Fig. C.2.
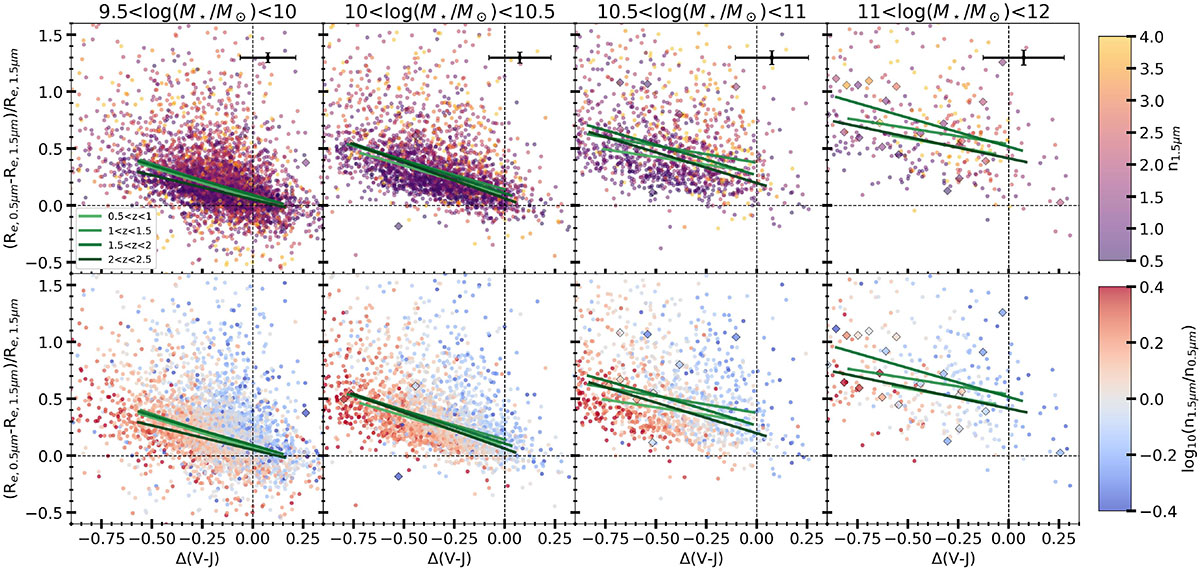
Download original image
V − J color gradient vs relative size variation in four stellar mass bins. The two rows show the same data but color-coded respectively with the Sérsic index at 1.5 μm (top row) and the logarithm difference of Sérsic indices at rest-frame 1.5 μm and 0.5 μm (lower row). Just star-forming galaxies are shown. Diamonds show sub-mm-selected galaxies and are color-coded following the same color scheme of the other galaxies. Colored green lines show the running median in redshift bins. In the top right corner, we present the median uncertainties. Massive star-forming galaxies have systematically stronger size variation with wavelength and stronger color gradients than low-mass galaxies. The variation of the Sérsic index with wavelength correlates more strongly with the color gradient than with the size gradient.
Current usage metrics show cumulative count of Article Views (full-text article views including HTML views, PDF and ePub downloads, according to the available data) and Abstracts Views on Vision4Press platform.
Data correspond to usage on the plateform after 2015. The current usage metrics is available 48-96 hours after online publication and is updated daily on week days.
Initial download of the metrics may take a while.