Fig. 2.
Download original image
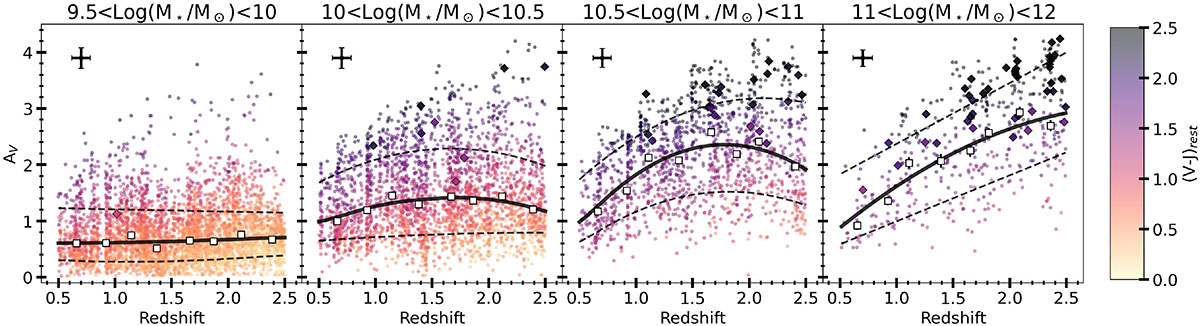
Attenuation in the V band (AV) as a function of redshift in four stellar mass bins for star-forming galaxies color-coded with their V − J color. The white squares show the median in stellar mass bins, and the error bars show the statistical uncertainty (![]() ). The solid black lines show the spline-percentile regression, and the dashed lines show the 16−84 percentiles of the distribution. The diamonds highlight submillimeter-selected galaxies. In the top left corner of each panel we show the median (16−84)/2 percentile ranges of the posterior distributions of AV and redshift as provided by EAZY.
). The solid black lines show the spline-percentile regression, and the dashed lines show the 16−84 percentiles of the distribution. The diamonds highlight submillimeter-selected galaxies. In the top left corner of each panel we show the median (16−84)/2 percentile ranges of the posterior distributions of AV and redshift as provided by EAZY.
Current usage metrics show cumulative count of Article Views (full-text article views including HTML views, PDF and ePub downloads, according to the available data) and Abstracts Views on Vision4Press platform.
Data correspond to usage on the plateform after 2015. The current usage metrics is available 48-96 hours after online publication and is updated daily on week days.
Initial download of the metrics may take a while.