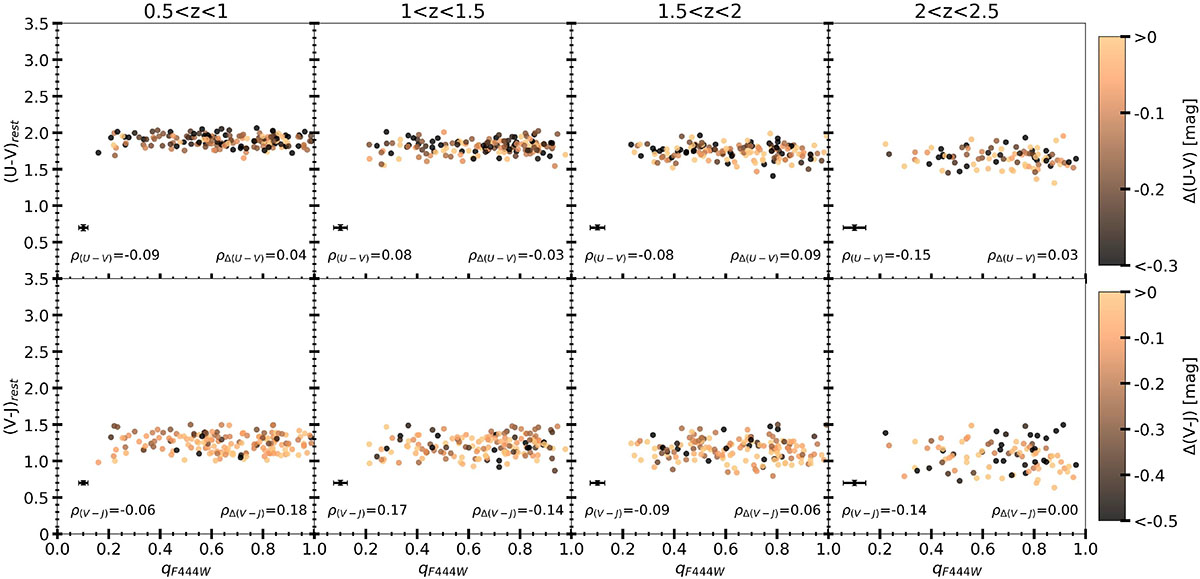
Fig. 7.
Download original image
Projected axis ratio (q) observed in JWST/NIRCam-F444W against U − V (upper panels) and V − J (lower panels) colors in four redshift bins. The color-coding shows the color gradient computed as the difference between the color between 1−2 Re and 0−1 Re. We only show quiescent galaxies with stellar mass M★ ≥ 1010.5 M⊙. In the lower left corner, we show the median uncertainties on the rest frame colors and axis ratios and the Spearman correlation coefficient between the axis ratio and the color, and in the right corner, we show that between the axis ratio and the color gradient.
Current usage metrics show cumulative count of Article Views (full-text article views including HTML views, PDF and ePub downloads, according to the available data) and Abstracts Views on Vision4Press platform.
Data correspond to usage on the plateform after 2015. The current usage metrics is available 48-96 hours after online publication and is updated daily on week days.
Initial download of the metrics may take a while.