Fig. 1.
Download original image
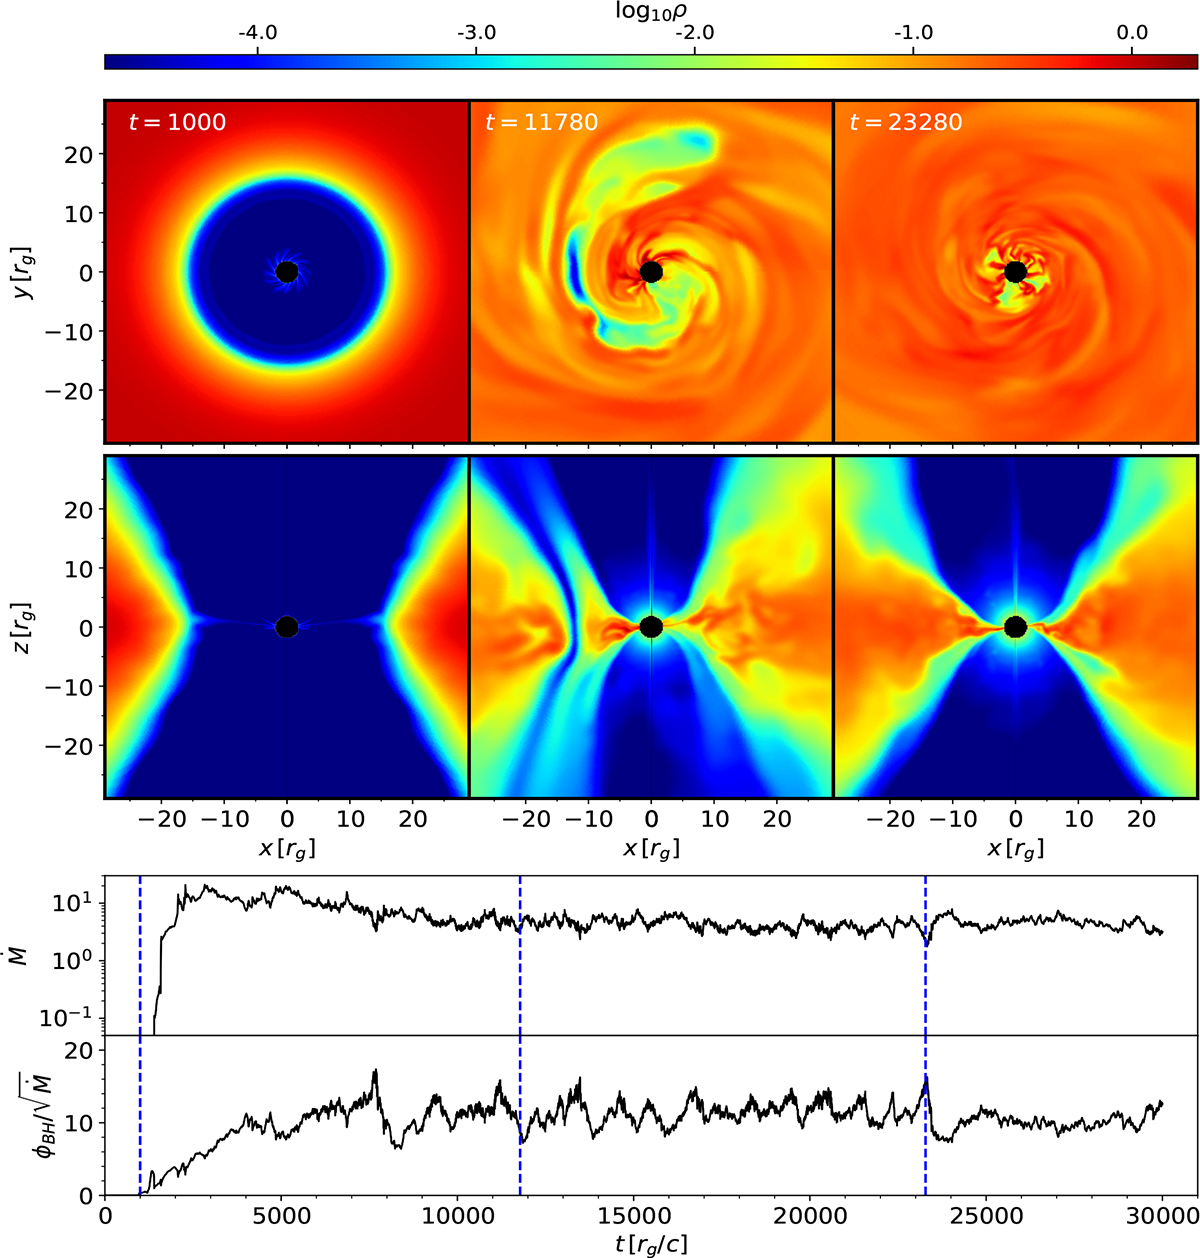
Evolution of our GRMHD simulation over time. The top and middle panels show the logarithm of the density in the equatorial and a meridional plane, respectively, for three different times. The bottom panel shows the temporal evolution of the mass accretion rate (Ṁ) and the MAD parameter, ![]() . The vertical dashed blue lines mark the time frames of the density plots.
. The vertical dashed blue lines mark the time frames of the density plots.
Current usage metrics show cumulative count of Article Views (full-text article views including HTML views, PDF and ePub downloads, according to the available data) and Abstracts Views on Vision4Press platform.
Data correspond to usage on the plateform after 2015. The current usage metrics is available 48-96 hours after online publication and is updated daily on week days.
Initial download of the metrics may take a while.