Fig. 10.
Download original image
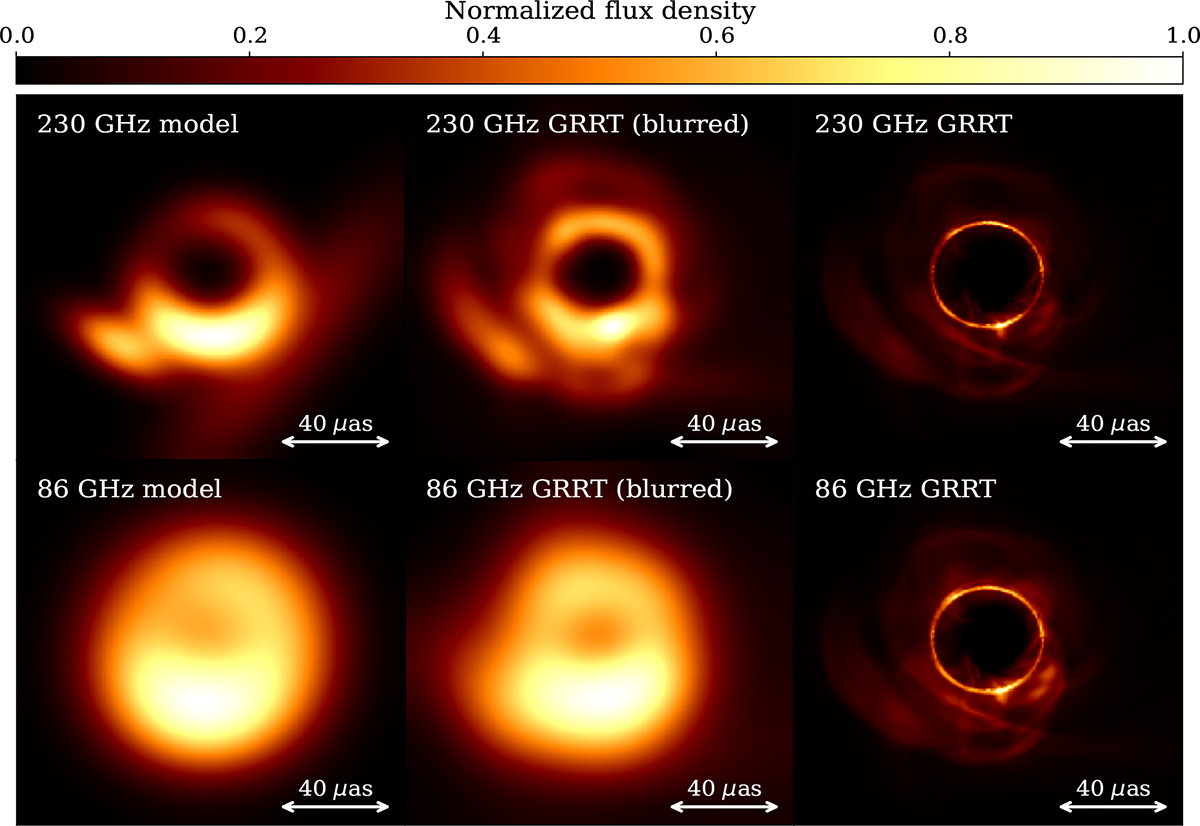
Comparison of the underlying GRRT data and the output of our model fitting at 230 GHz (top) and 86 GHz (bottom) for t = 29 800 M. Right column: Output of the GRRT calculations, non-blurred. Central column: Same GRRT images, blurred by a beam of 10 μas and 27 μas for 230 GHz and 86 GHz, respectively. Left column: Parametrized model resulting from our fitting procedure, blurred with those same beams. All plots have been normalized to their maximum flux for ease of comparison. Note the increased surrounding flux at 86 GHz in the right column.
Current usage metrics show cumulative count of Article Views (full-text article views including HTML views, PDF and ePub downloads, according to the available data) and Abstracts Views on Vision4Press platform.
Data correspond to usage on the plateform after 2015. The current usage metrics is available 48-96 hours after online publication and is updated daily on week days.
Initial download of the metrics may take a while.