Fig. 12.
Download original image
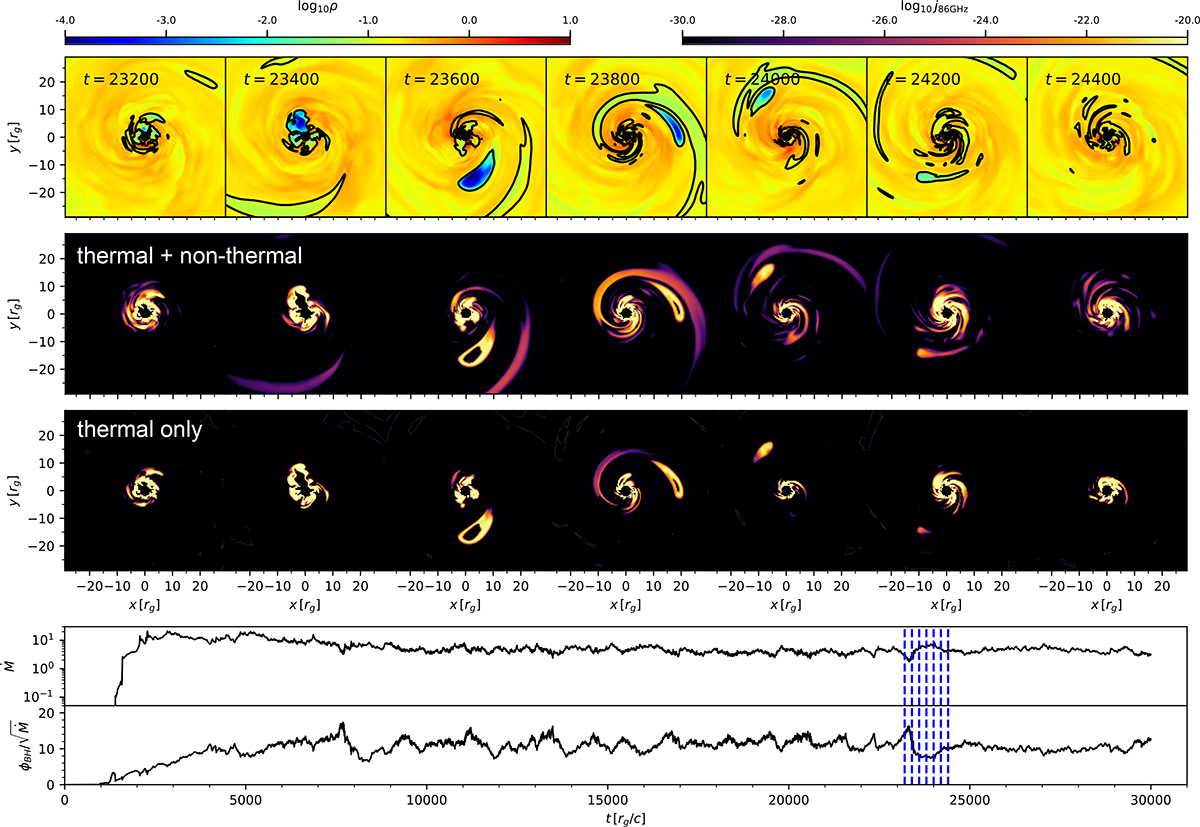
Evolution of a MAD event in the equatorial plane. Top row: Logarithm of the density with overlaid contours indicating locations of particle acceleration, where ![]() . Second and third rows: Logarithm of the total emissivity, for a thermal plus kappa eDF and thermal-only eDF using the parameters listed in Table 1. Two bottom panels: Evolution of the mass accretion rate, Ṁ, and the MAD parameter,
. Second and third rows: Logarithm of the total emissivity, for a thermal plus kappa eDF and thermal-only eDF using the parameters listed in Table 1. Two bottom panels: Evolution of the mass accretion rate, Ṁ, and the MAD parameter, ![]() . The vertical blue lines indicate the temporal position of the top panels.
. The vertical blue lines indicate the temporal position of the top panels.
Current usage metrics show cumulative count of Article Views (full-text article views including HTML views, PDF and ePub downloads, according to the available data) and Abstracts Views on Vision4Press platform.
Data correspond to usage on the plateform after 2015. The current usage metrics is available 48-96 hours after online publication and is updated daily on week days.
Initial download of the metrics may take a while.