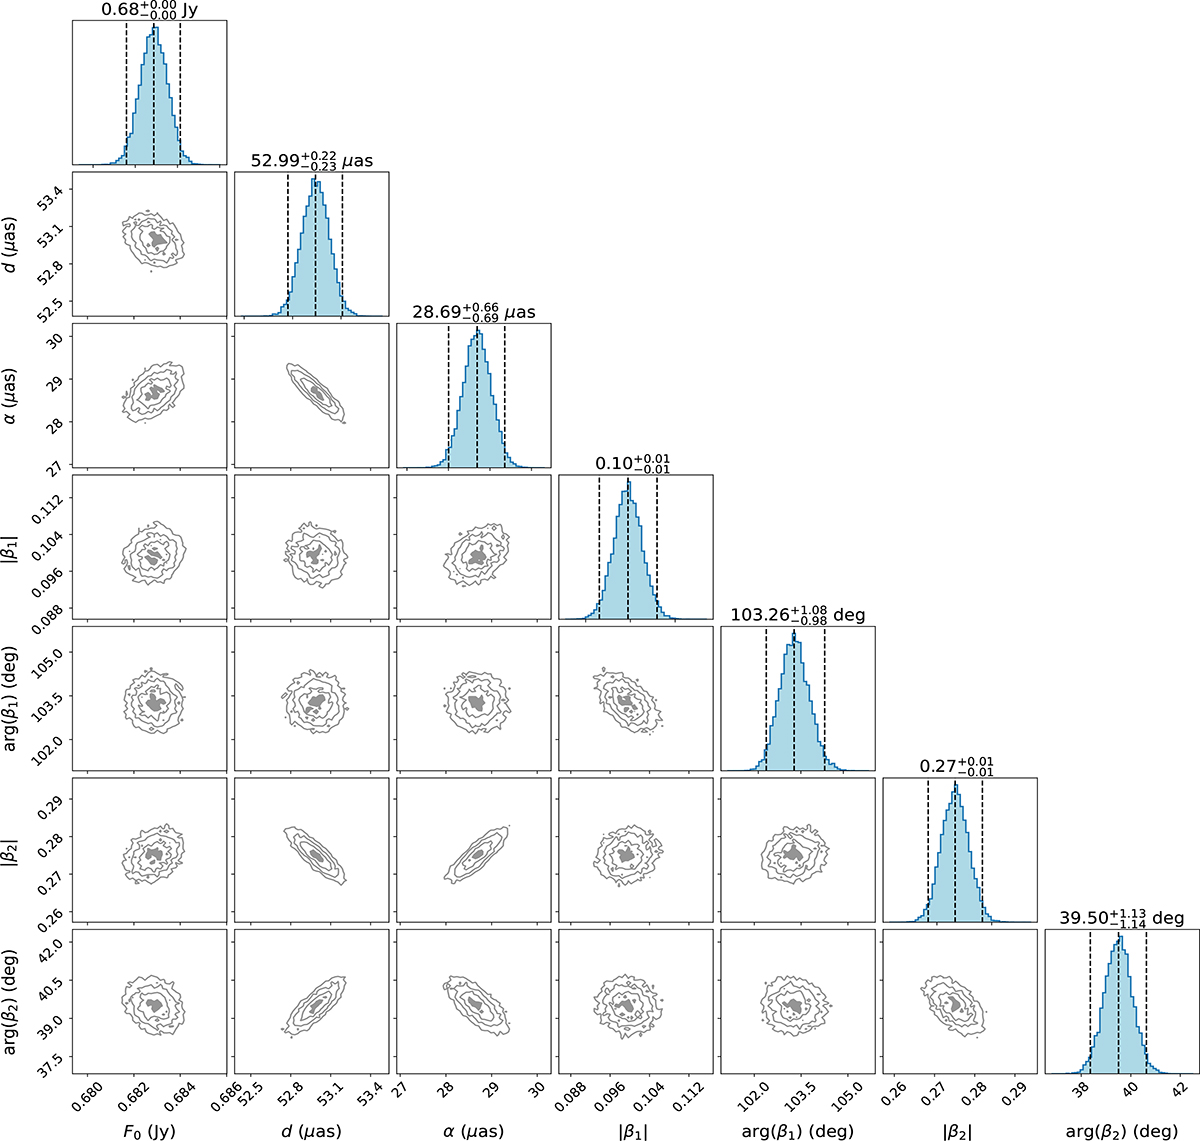
Fig. B.2.
Download original image
Bayesian posterior distributions of the thick m-ring model to the 86 GHz data at t = 26000 M. The diagonal panels show the posterior distributions and the most probable value of each parameter, given as the median value. The vertical dashed lines show this median value as well as the 2σ range, which is taken as the upper and lower error. The 2D histograms show the joint distributions of each parameter pair (row and column-wise) that shows possible correlations. Contours have been drawn following the samples at different intervals. The innermost shaded area contains samples with a likelihood of 0.5σ, and the outer contours contain the 1σ, 1.5σ, and 2σ likelihoods. The total extent of the plots corresponds to a 5σ likelihood.
Current usage metrics show cumulative count of Article Views (full-text article views including HTML views, PDF and ePub downloads, according to the available data) and Abstracts Views on Vision4Press platform.
Data correspond to usage on the plateform after 2015. The current usage metrics is available 48-96 hours after online publication and is updated daily on week days.
Initial download of the metrics may take a while.