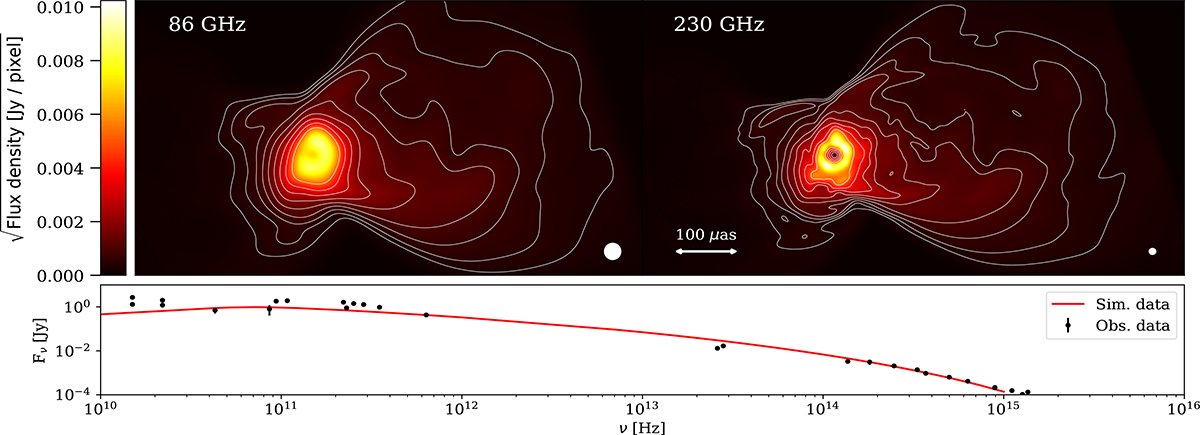
Fig. 2.
Download original image
Results of the GRRT calculations at t = 26 000 M. The images show the flux density at 86 GHz and 230 GHz. Notice that the images are convolved with half of the nominal resolution of the GMVA (27 μas) and the EHT (10 μas), indicated by the white circle at the bottom right. The contours begin at 1/1000 of the maximum flux density and increase by factors of two. In the bottom panel we display the broadband radio spectrum of our model. The observational flux values are taken from Prieto et al. (2016), Perlman et al. (2001), Whysong & Antonucci (2004), Hada et al. (2017), and Lister et al. (2018).
Current usage metrics show cumulative count of Article Views (full-text article views including HTML views, PDF and ePub downloads, according to the available data) and Abstracts Views on Vision4Press platform.
Data correspond to usage on the plateform after 2015. The current usage metrics is available 48-96 hours after online publication and is updated daily on week days.
Initial download of the metrics may take a while.