Open Access
Fig. 3.
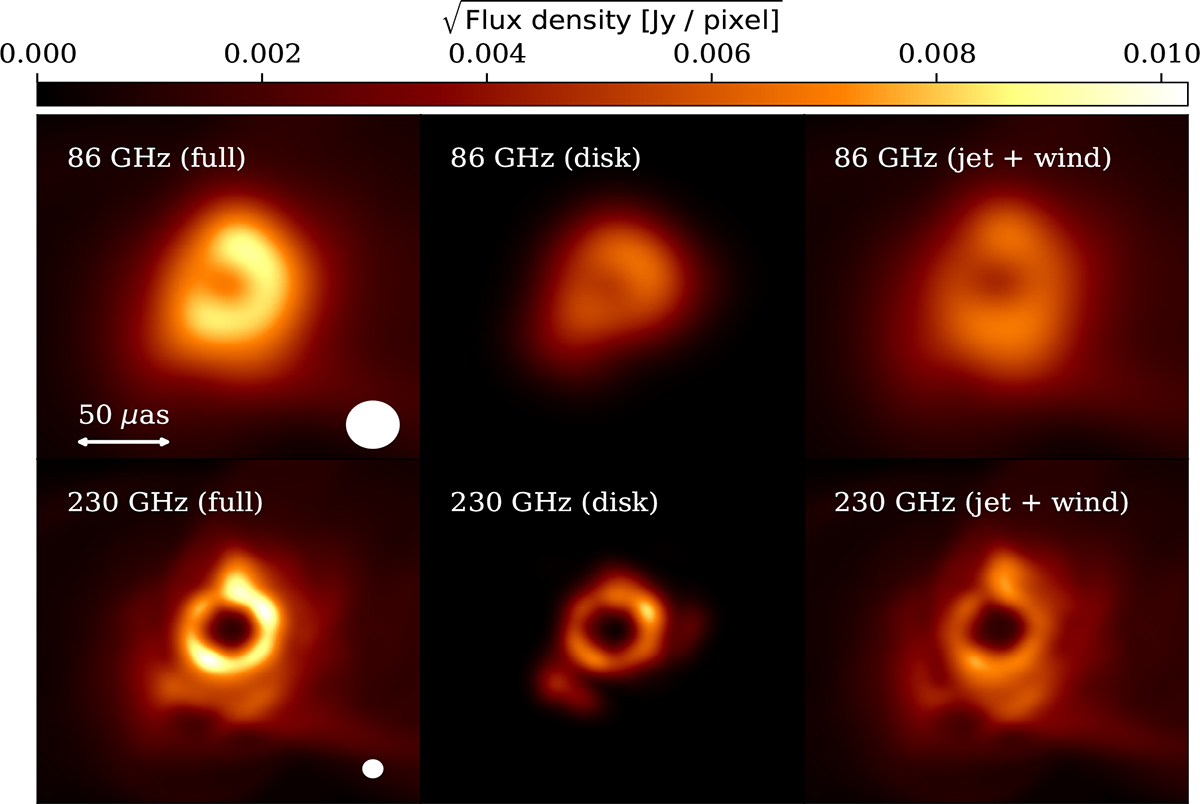
Download original image
Structural decomposition of the horizon scale structure in our model at t = 26 000 M. The panels show from left to right the total, disk, and jet plus wind contributions for 86 GHz (top row) and 230 GHz (bottom row).
Current usage metrics show cumulative count of Article Views (full-text article views including HTML views, PDF and ePub downloads, according to the available data) and Abstracts Views on Vision4Press platform.
Data correspond to usage on the plateform after 2015. The current usage metrics is available 48-96 hours after online publication and is updated daily on week days.
Initial download of the metrics may take a while.