Fig. 7.
Download original image
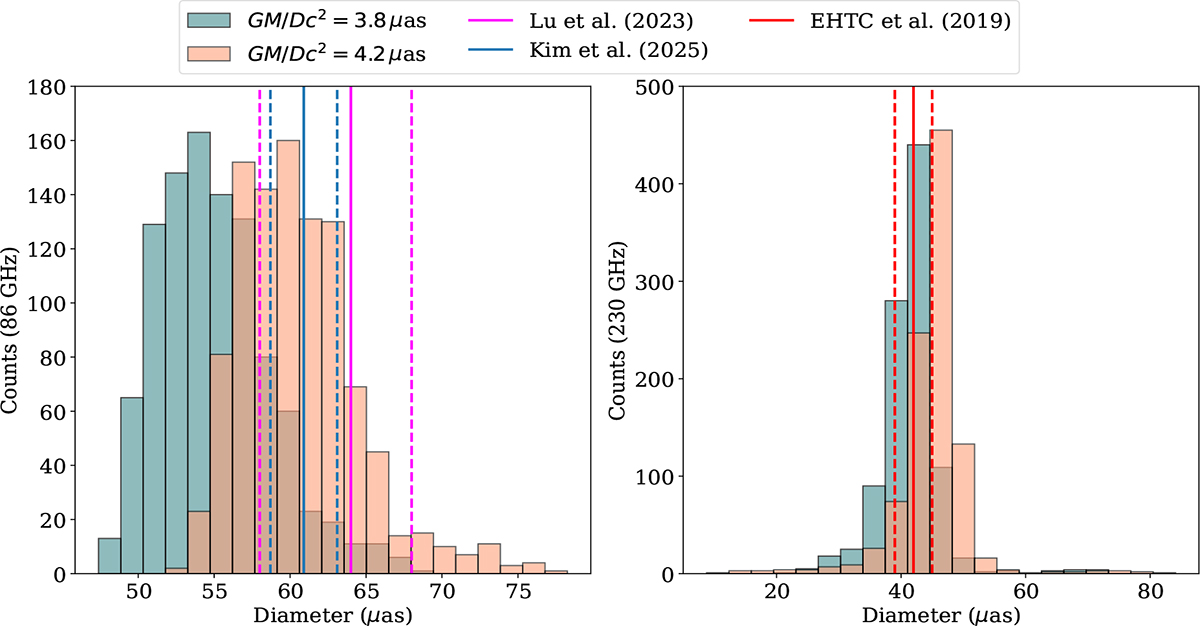
Distribution of the diameters resulting from fitting our models to the 86 GHz and 230 GHz datasets. The turquoise and orange histograms show, respectively, the result of model fitting to GRRT data with an angular scale of 3.8 μas and 4.2 μas. The vertical lines show the observational range for the diameter of the ring, using the same values as Fig. 6.
Current usage metrics show cumulative count of Article Views (full-text article views including HTML views, PDF and ePub downloads, according to the available data) and Abstracts Views on Vision4Press platform.
Data correspond to usage on the plateform after 2015. The current usage metrics is available 48-96 hours after online publication and is updated daily on week days.
Initial download of the metrics may take a while.