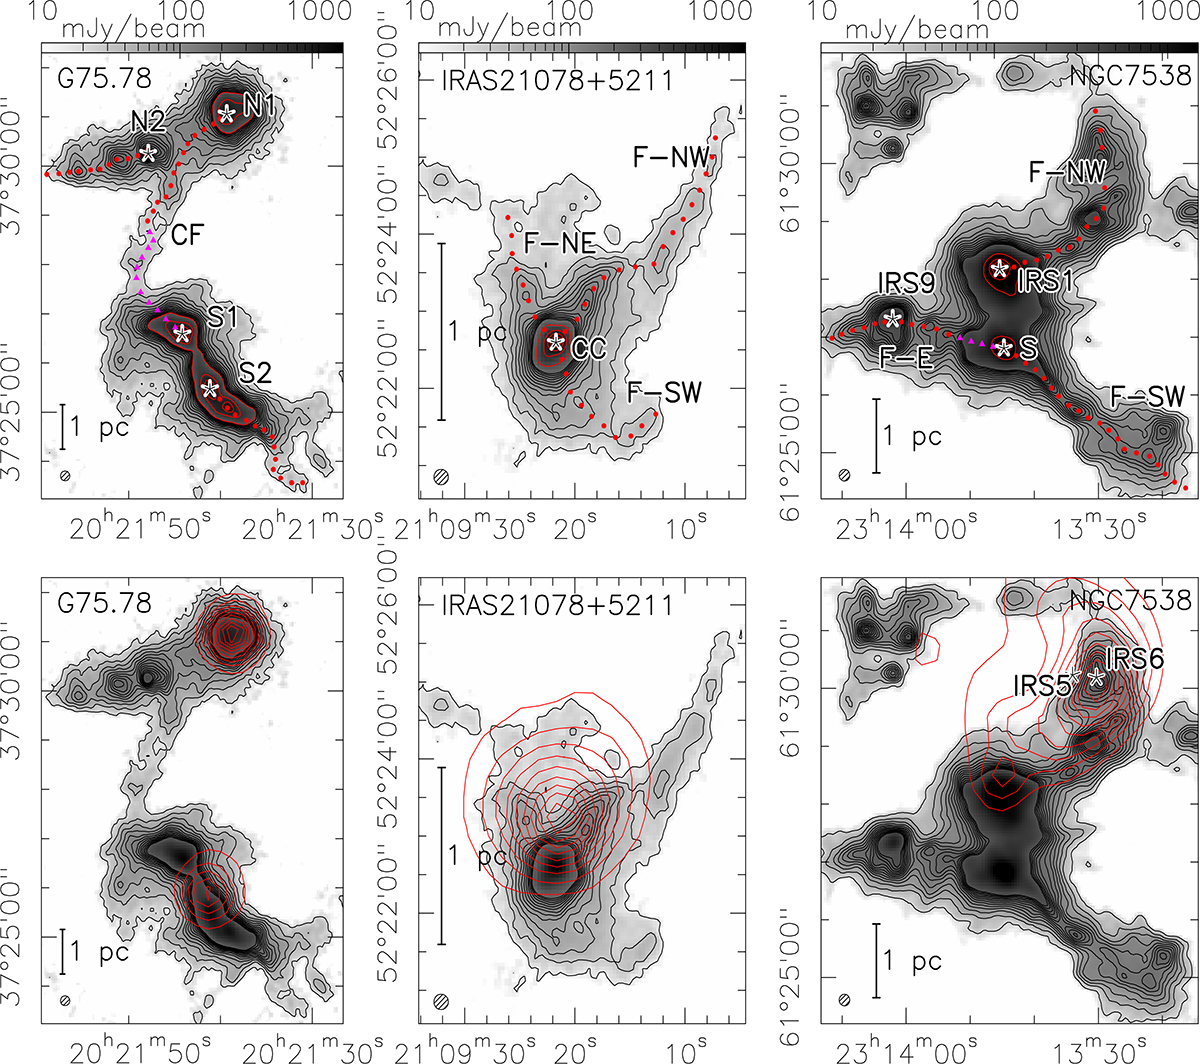
Fig. 1.
Download original image
Top row: NIKA2 1.2 mm dust continuum maps (see Beuther et al. 2024) of the star-forming regions showing the clump and filament designations. The red and magenta markers indicate the data points used for the flow rate estimation in Section 3.2. The triangular magenta markers indicate a separate section along a structure. Black contours outline the 1.2 mm continuum, ranging from 3σ to 39σ in steps of 3σ (the RMS values are presented in Table 5). The red contours in the upper panels mark the peak positions of the continuum emission from 20% to 100% in steps of 20%. The designations used in the following refer to clumps and filament structures, filaments are labeled F; CF in G75 is the central filament; CC in IRAS21078 is the central clump. The clumps in NGC7538 are the known objects IRS9, IRS1 and S (e.g., Beuther 2020). G75 S1 is the object G75.78+0.34. We present the clump designations together with their coordinates in Table 3. Bottom row: Same dust-maps, but with red contour lines outlining the HII1.2ex regions at 1.4 GHz (21 cm) (Condon et al. 1998); the contours range from 10% to 100% of the peak emission in steps of 10% (see Table 5 for reference). The positions of the two main exciting sources of the HII1.2ex region in NGC7538, NGC7538 IRS5 and NGC7538 IRS6, are marked in the lower right panel (Puga et al. 2010).
Current usage metrics show cumulative count of Article Views (full-text article views including HTML views, PDF and ePub downloads, according to the available data) and Abstracts Views on Vision4Press platform.
Data correspond to usage on the plateform after 2015. The current usage metrics is available 48-96 hours after online publication and is updated daily on week days.
Initial download of the metrics may take a while.