Fig. 16.
Download original image
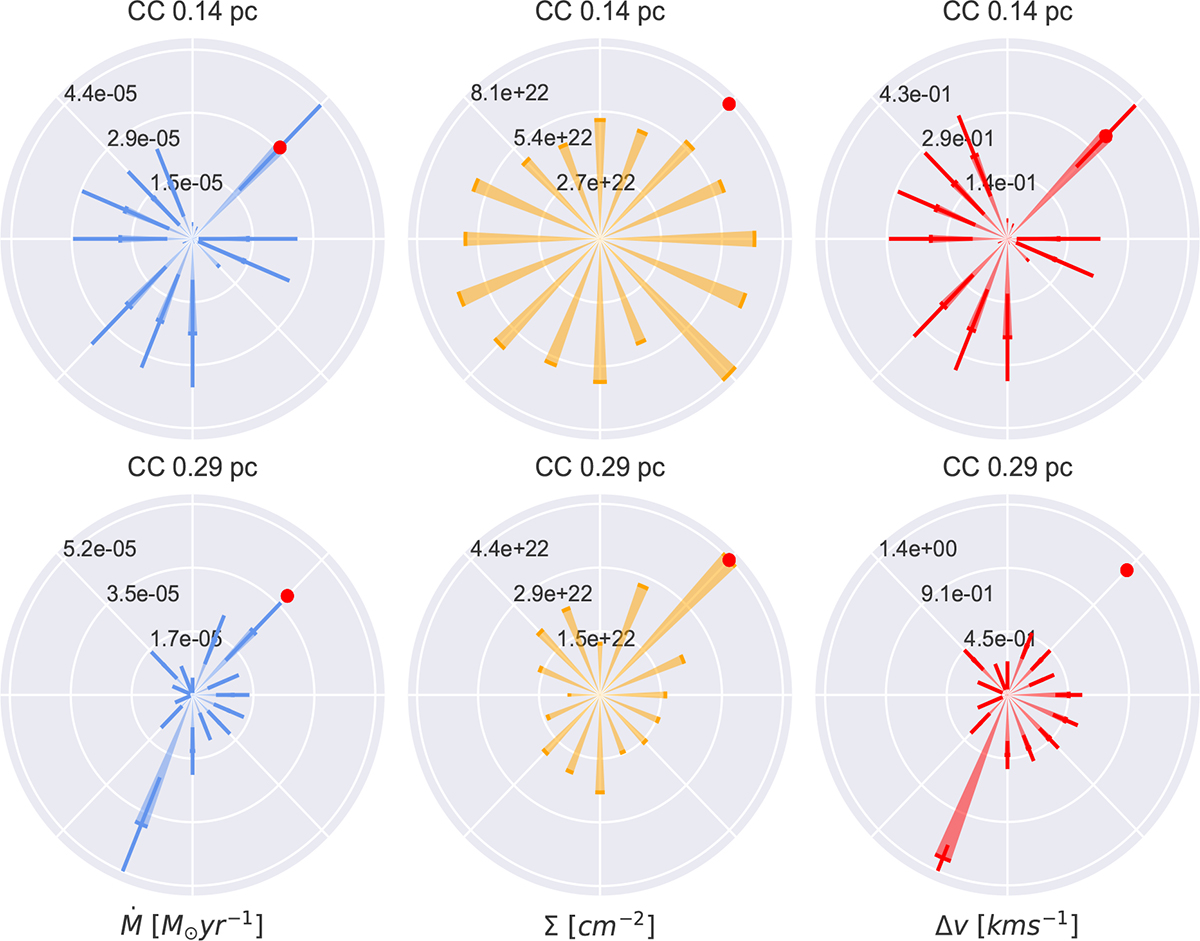
Comparison panels for the clump-centered flow approach. Columns from left to right: Total estimated mass flow rate, surface density and velocity difference for IRAS21078 CC (Fig. 1). Top row: Inner circle at 0.14 pc. Bottom row: Outer circle at 0.29 pc. The red dots indicate adjacent filaments that are assumed to host the potential flow direction.
Current usage metrics show cumulative count of Article Views (full-text article views including HTML views, PDF and ePub downloads, according to the available data) and Abstracts Views on Vision4Press platform.
Data correspond to usage on the plateform after 2015. The current usage metrics is available 48-96 hours after online publication and is updated daily on week days.
Initial download of the metrics may take a while.