Fig. 18.
Download original image
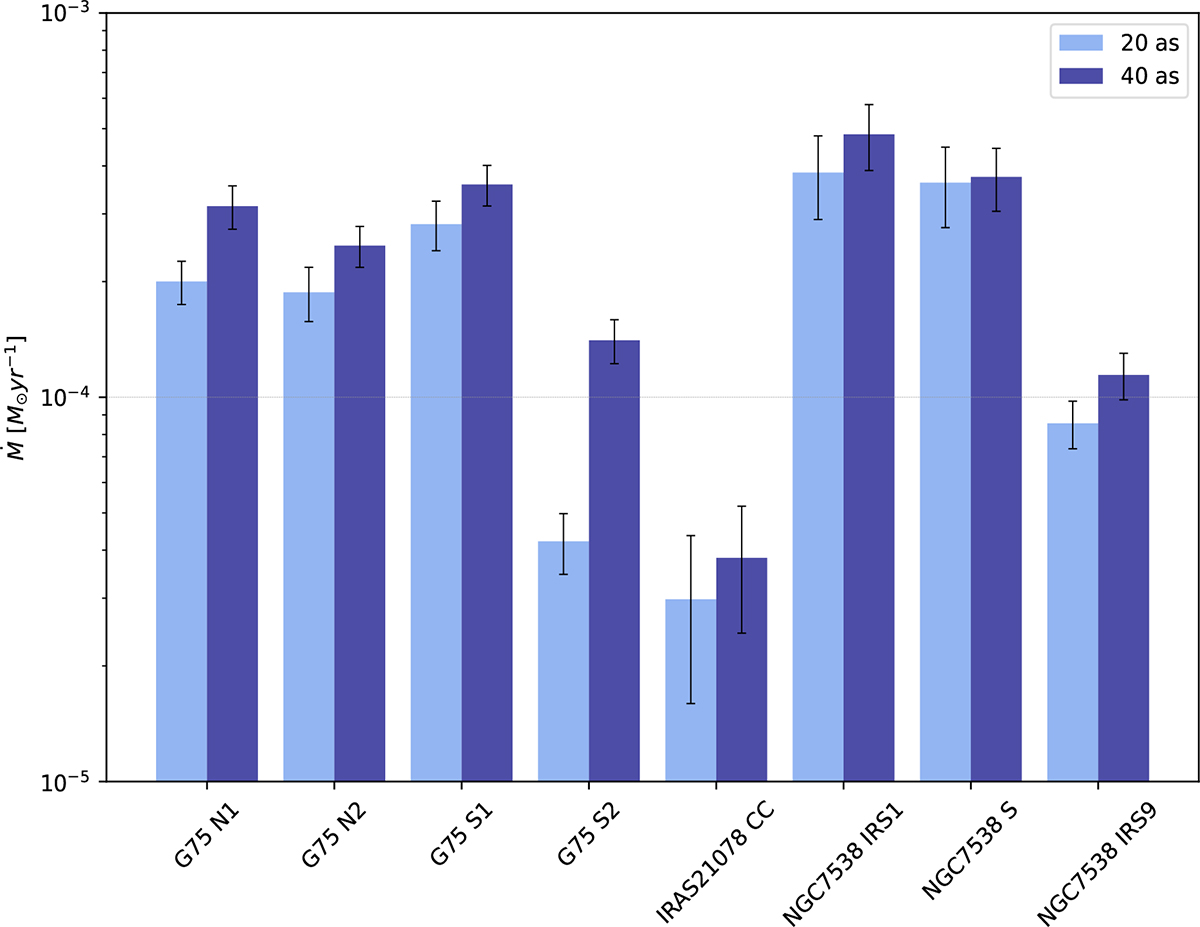
Peak values of the estimated mass flow rate toward clumps. The light blue bars show the values for the 20″ distance, while the dark blue bars show values for the 40″ distance. The error bars show the maximum error of the respective mass flow rate. We note that this chart shows the maximum values of Ṁ alone, and contains no information about the direction from the polar plots.
Current usage metrics show cumulative count of Article Views (full-text article views including HTML views, PDF and ePub downloads, according to the available data) and Abstracts Views on Vision4Press platform.
Data correspond to usage on the plateform after 2015. The current usage metrics is available 48-96 hours after online publication and is updated daily on week days.
Initial download of the metrics may take a while.