Fig. C.2.
Download original image
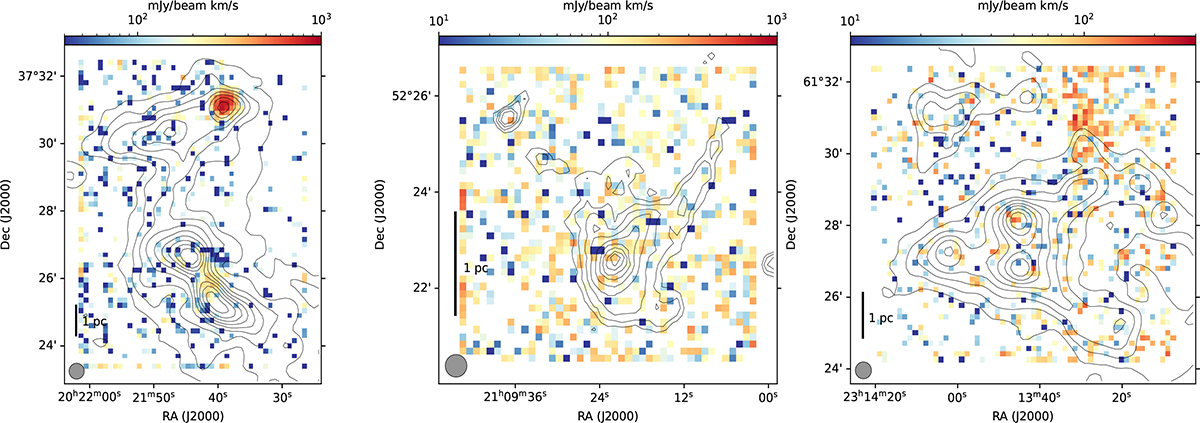
Moment zero maps of the H41α recombination line tracing the free–free contribution. The black contours outline the free–free corrected 1.2 mm dust continuum (except for IRAS21078) on log-scale starting from 5σ (except for IRAS21078 starting from 3σ) to peak value for reference. For G75 (left panel) and NGC7538 (right panel) the strongest emission fits the contours in the lower panels of Fig. 1; for IRAS21078 (middle panel) there is only noise and no significant contribution from the HII1.2ex region outlined in NVSS. The edges have been set to values of zero in order to eliminate the stripe artifacts from the OTF scanning process. All blank spots represent zero values due to the log-scaling.
Current usage metrics show cumulative count of Article Views (full-text article views including HTML views, PDF and ePub downloads, according to the available data) and Abstracts Views on Vision4Press platform.
Data correspond to usage on the plateform after 2015. The current usage metrics is available 48-96 hours after online publication and is updated daily on week days.
Initial download of the metrics may take a while.