Fig. 4.
Download original image
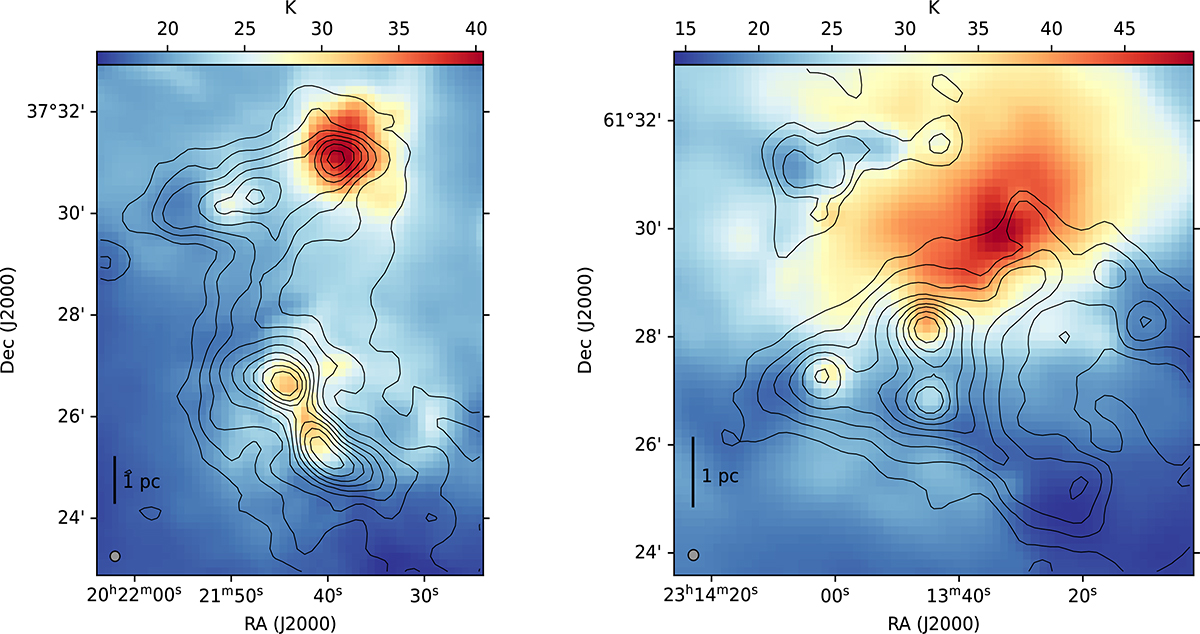
Dust temperature maps of G75 (left panel) and NGC7538 (right panel). Both maps were created using Herschel data (Molinari et al. 2010) and free–free corrected dust continuum emission from the NIKA2 dataset. In the bottom left corner the 27″ beam of the final data product is shown. The black contours outline the free–free corrected 1.2 mm continuum emission at 27″ resolution in logarithmic scale from 5σ to peak value.
Current usage metrics show cumulative count of Article Views (full-text article views including HTML views, PDF and ePub downloads, according to the available data) and Abstracts Views on Vision4Press platform.
Data correspond to usage on the plateform after 2015. The current usage metrics is available 48-96 hours after online publication and is updated daily on week days.
Initial download of the metrics may take a while.