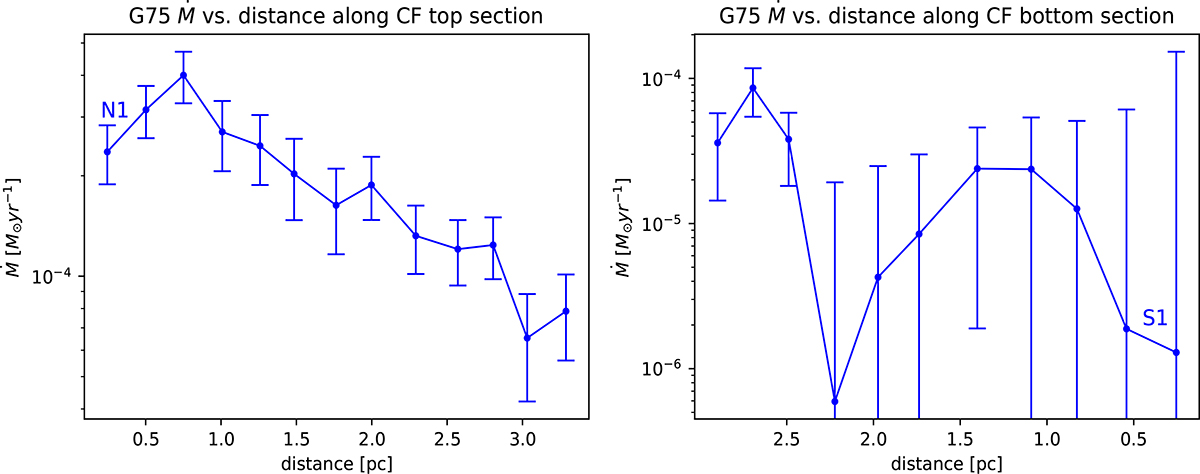
Fig. 6.
Download original image
Estimated mass flow rate as a function of the distance along the CF filament structure in G75 (the connecting filament, see red and purple markers in Fig. 1). Left panel: Top section. Right panel: Bottom section. The plots follows the north–south direction from left to right. The velocity differences are taken relative to N1 for the left panel and relative to S1 for the right panel (see annotations).
Current usage metrics show cumulative count of Article Views (full-text article views including HTML views, PDF and ePub downloads, according to the available data) and Abstracts Views on Vision4Press platform.
Data correspond to usage on the plateform after 2015. The current usage metrics is available 48-96 hours after online publication and is updated daily on week days.
Initial download of the metrics may take a while.