Open Access
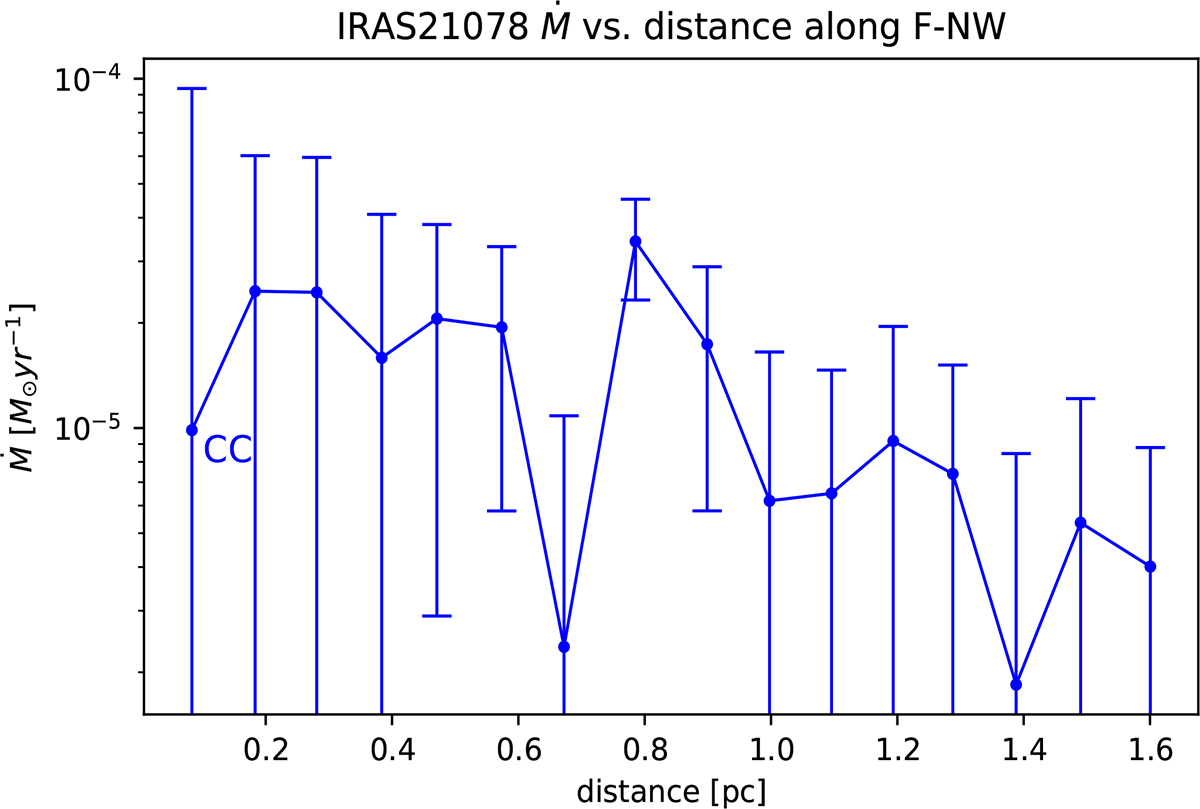
Fig. 7.
Download original image
Estimated mass flow rate as a function of the distance along the F-NW filament structure in IRAS21078 (Fig. 1). The graph follows the direction of measurement away from the clump, as indicated by the annotation.
Current usage metrics show cumulative count of Article Views (full-text article views including HTML views, PDF and ePub downloads, according to the available data) and Abstracts Views on Vision4Press platform.
Data correspond to usage on the plateform after 2015. The current usage metrics is available 48-96 hours after online publication and is updated daily on week days.
Initial download of the metrics may take a while.