Open Access
Fig. 9.
Download original image
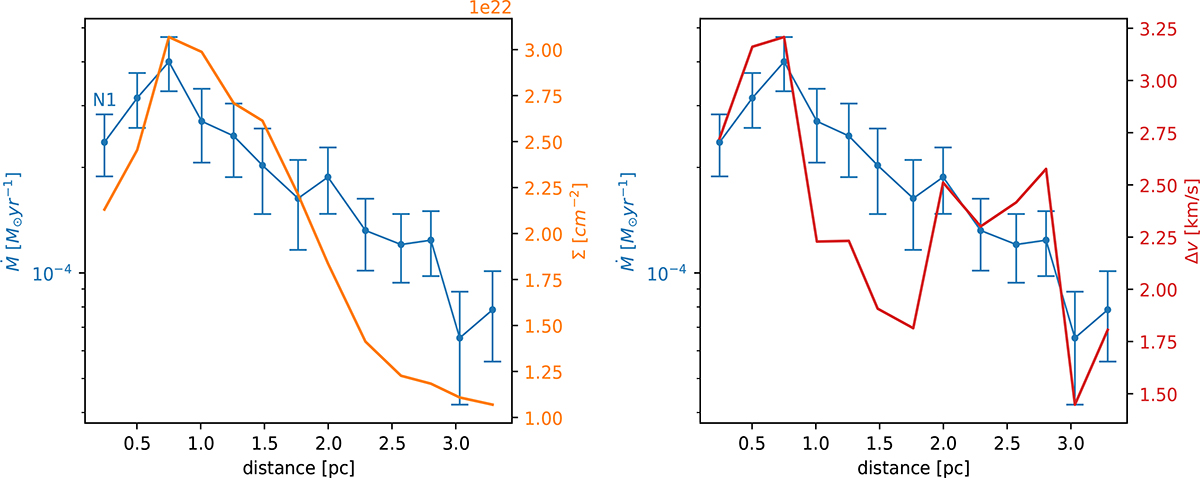
Light blue graph: Mass flow rate as a function of the distance between adjacent points in G75 CF top section (Fig. 1, left panel in Fig. 6). Orange graph, left panel: Surface density along the CF structure top section in G75. Red graph, right panel: Velocity differences along the CF structure top section in G75.
Current usage metrics show cumulative count of Article Views (full-text article views including HTML views, PDF and ePub downloads, according to the available data) and Abstracts Views on Vision4Press platform.
Data correspond to usage on the plateform after 2015. The current usage metrics is available 48-96 hours after online publication and is updated daily on week days.
Initial download of the metrics may take a while.