Fig. 3
Download original image
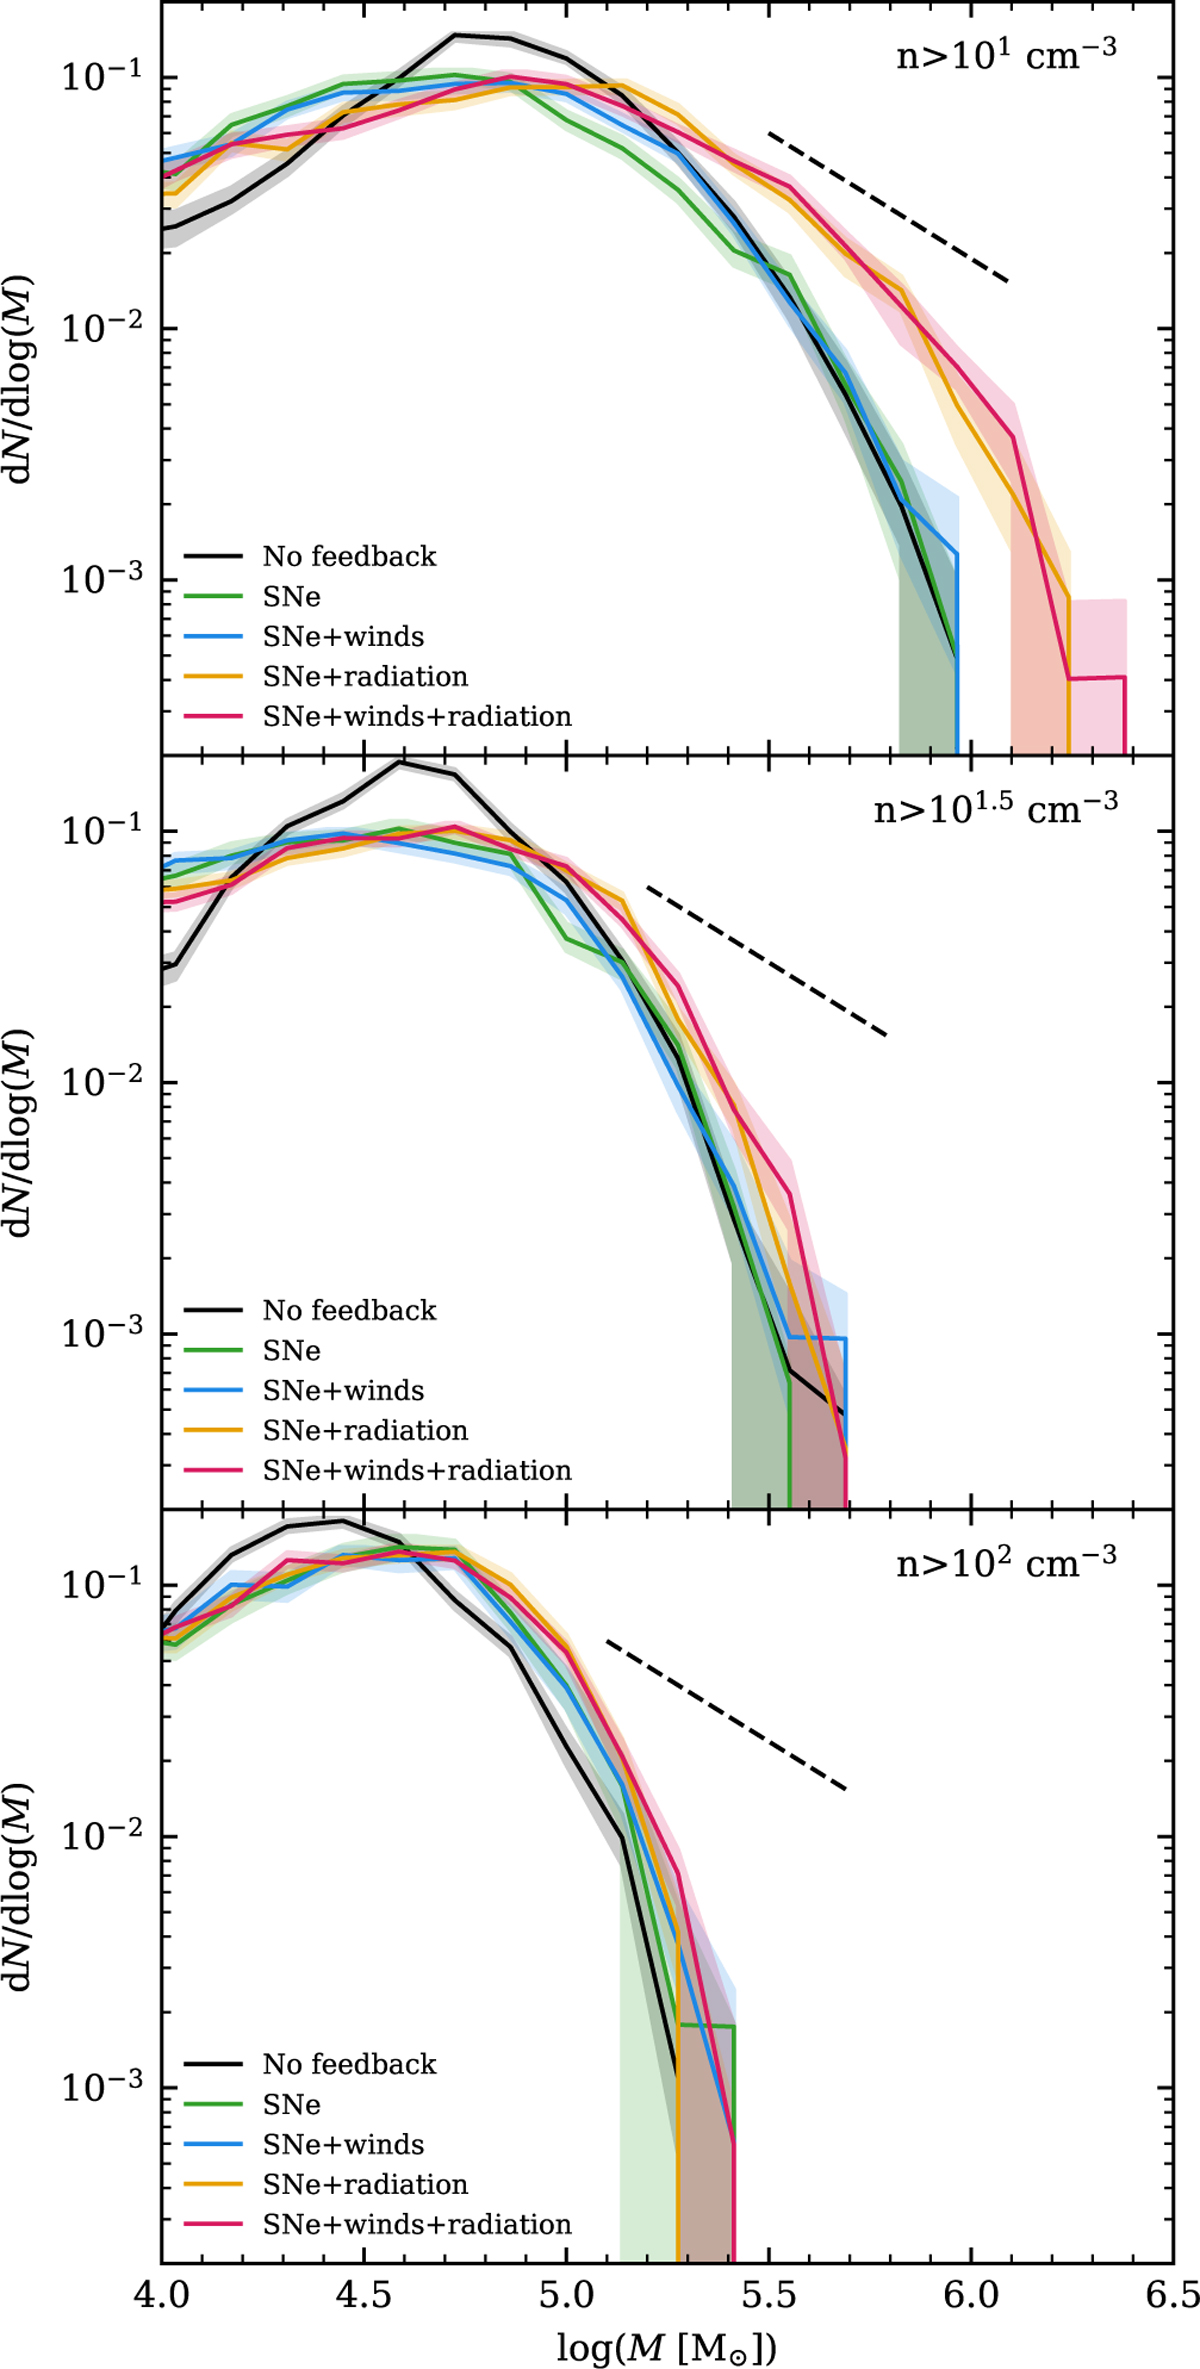
Mass distributions for cloud complexes with n > 10 cm−3 (top), big clouds with n > 101.5 cm−3 (middle), and clouds with n > 102 cm−3 (bottom). The lines show the median values, while the shaded regions show the 16th–84th percentile range. All distributions shown contain structures from multiple snapshots, where consecutive snapshots are 25 Myr apart. The dashed line shows dN/d log(M) ∝ M−1, i.e., dN/dM ∝ M−2.
Current usage metrics show cumulative count of Article Views (full-text article views including HTML views, PDF and ePub downloads, according to the available data) and Abstracts Views on Vision4Press platform.
Data correspond to usage on the plateform after 2015. The current usage metrics is available 48-96 hours after online publication and is updated daily on week days.
Initial download of the metrics may take a while.