Open Access
Fig. 4
Download original image
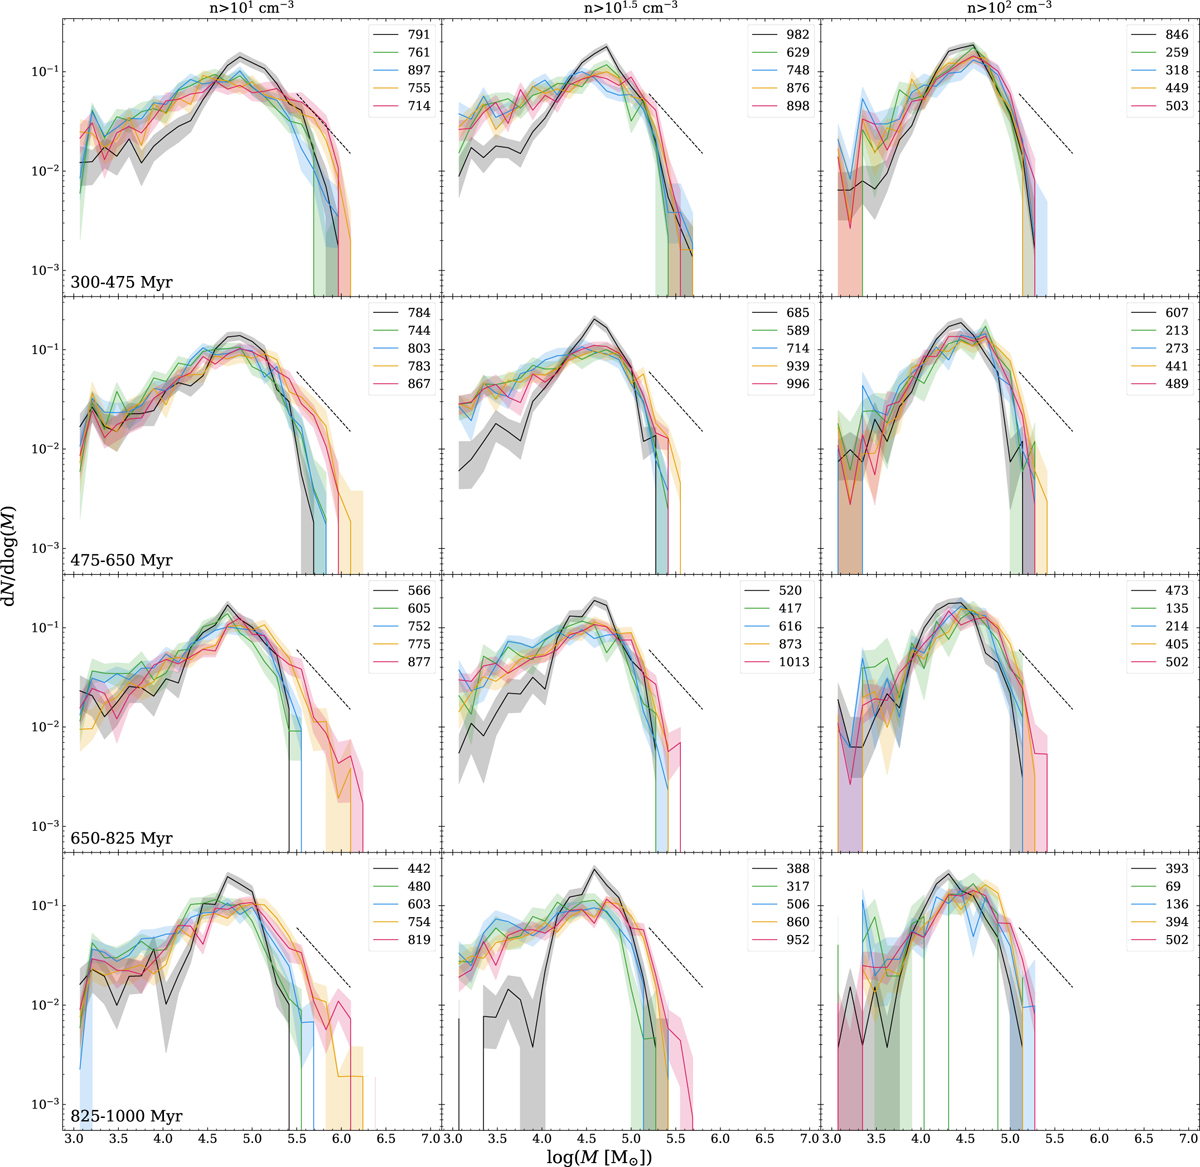
Cloud mass distributions in 175 Myr time bins. Feedback is color-coded as in Fig. 3, and the number of clouds in each distribution is given in the legend. The lines show the median values, while the shaded regions show the 16th–84th percentile range.
Current usage metrics show cumulative count of Article Views (full-text article views including HTML views, PDF and ePub downloads, according to the available data) and Abstracts Views on Vision4Press platform.
Data correspond to usage on the plateform after 2015. The current usage metrics is available 48-96 hours after online publication and is updated daily on week days.
Initial download of the metrics may take a while.