Open Access
Fig. 7
Download original image
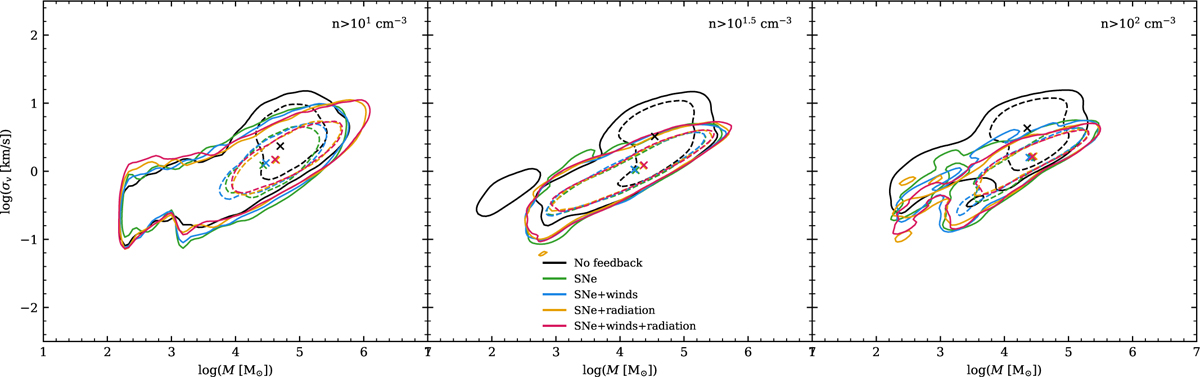
Distribution of velocity dispersion against mass for cloud complexes (left), big clouds (center), and clouds (right). The median of the distribution is marked with a cross, while the 68th and 95th percentiles are shown as dashed and solid lines, respectively. Different models are color-coded as indicated in the legend.
Current usage metrics show cumulative count of Article Views (full-text article views including HTML views, PDF and ePub downloads, according to the available data) and Abstracts Views on Vision4Press platform.
Data correspond to usage on the plateform after 2015. The current usage metrics is available 48-96 hours after online publication and is updated daily on week days.
Initial download of the metrics may take a while.