Open Access
Fig. 1.
Download original image
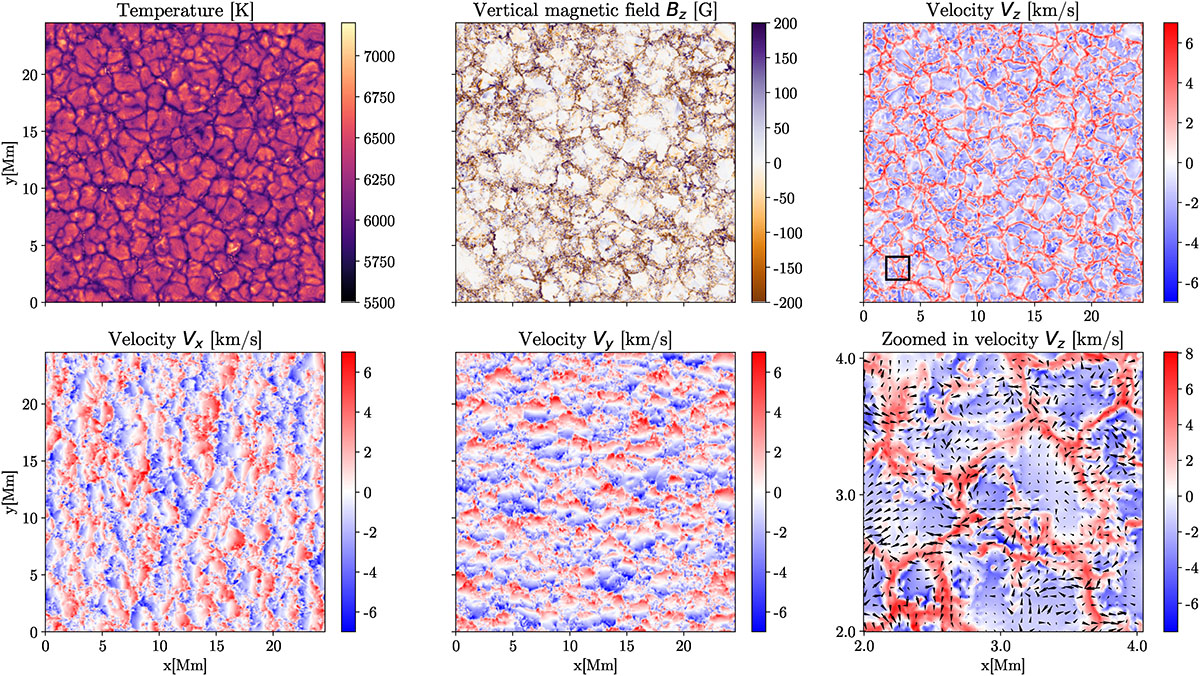
Temperature, vertical magnetic field, and the three components of the velocity at log τ500 = 0 for the first considered timestep of the simulation. The black square in the upper-right panel marks the region shown in the lower-right panel. Arrows in the lower-right panel indicate horizontal velocities.
Current usage metrics show cumulative count of Article Views (full-text article views including HTML views, PDF and ePub downloads, according to the available data) and Abstracts Views on Vision4Press platform.
Data correspond to usage on the plateform after 2015. The current usage metrics is available 48-96 hours after online publication and is updated daily on week days.
Initial download of the metrics may take a while.