Open Access
Fig. 10.
Download original image
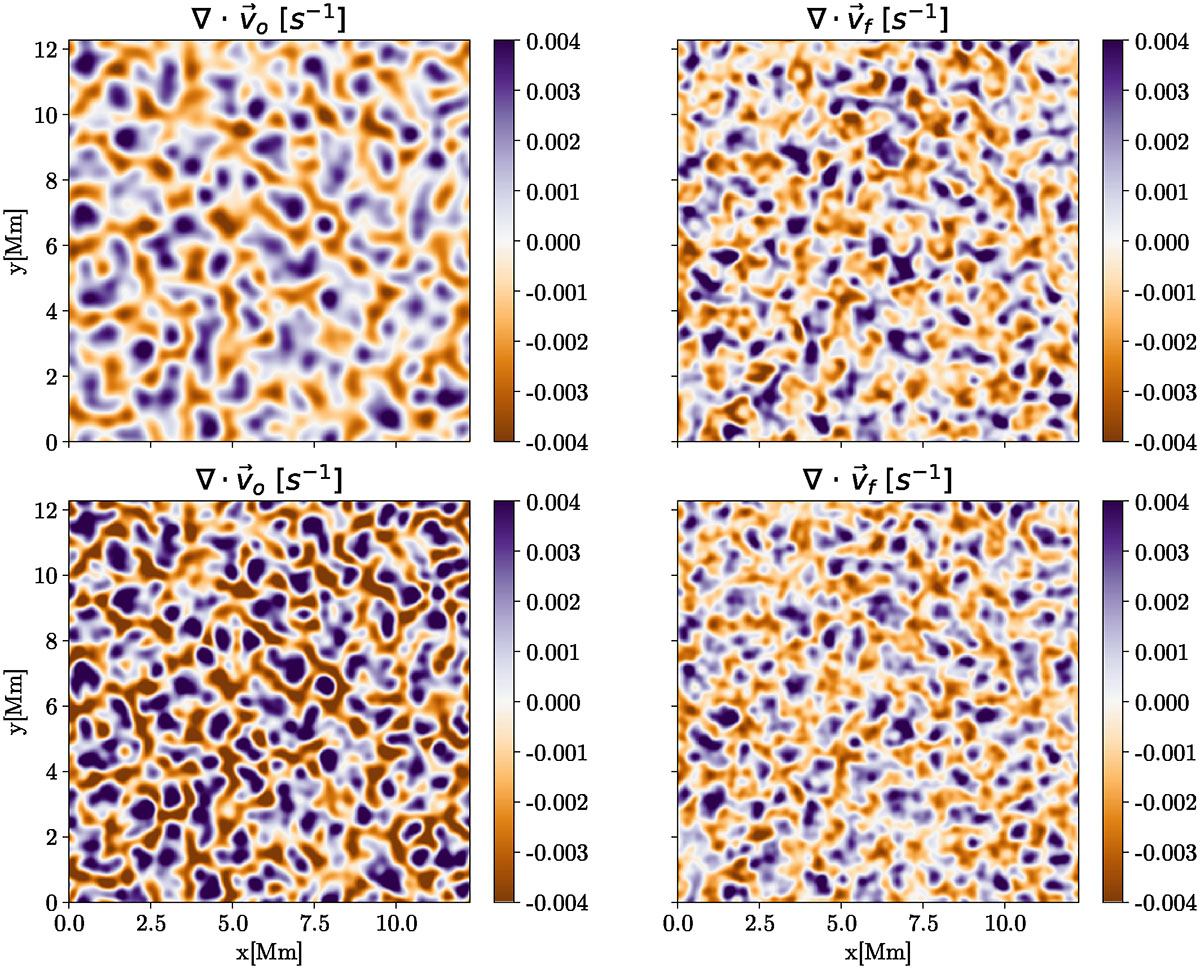
Comparison between velocity divergence calculated using vo (left panels) at log τ500 = −1 and vf inferred from the Fe I line (right panels). Top: Results with an apodizing window of 600 km. Bottom: Results with an apodizing window of 300 km.
Current usage metrics show cumulative count of Article Views (full-text article views including HTML views, PDF and ePub downloads, according to the available data) and Abstracts Views on Vision4Press platform.
Data correspond to usage on the plateform after 2015. The current usage metrics is available 48-96 hours after online publication and is updated daily on week days.
Initial download of the metrics may take a while.