Fig. 2.
Download original image
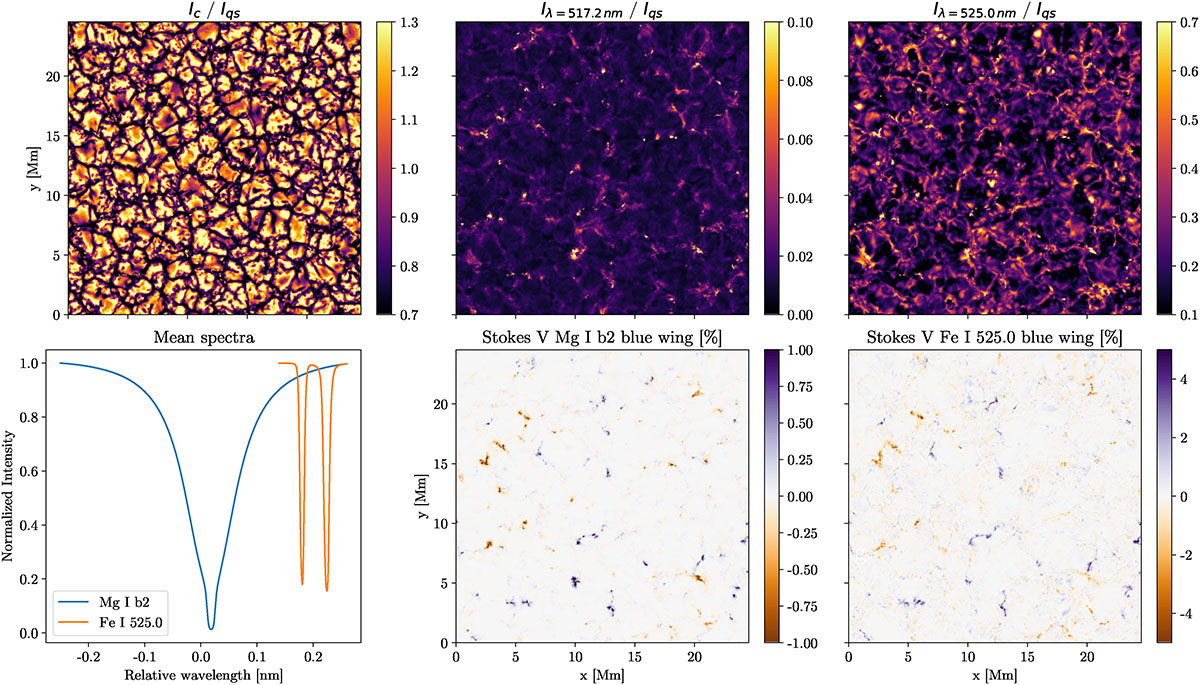
Synthetic observables calculated for the first snapshot in the series. Top left: Continuum image at 517.2 nm. Top middle: Nominal line core of the Mg I b2 line. Top right: Nominal line core of Fe I 525.0 nm line. Bottom left: Spatially averaged spectra of the considered spectral lines, Fe I lines are shifted for clarity. Bottom middle: Circular polarization in the wing of the Mg I line. Bottom right: Circular polarization in the wing of the Fe I line. The upper-row panels are shown in units of the mean quiet-Sun continuum.
Current usage metrics show cumulative count of Article Views (full-text article views including HTML views, PDF and ePub downloads, according to the available data) and Abstracts Views on Vision4Press platform.
Data correspond to usage on the plateform after 2015. The current usage metrics is available 48-96 hours after online publication and is updated daily on week days.
Initial download of the metrics may take a while.