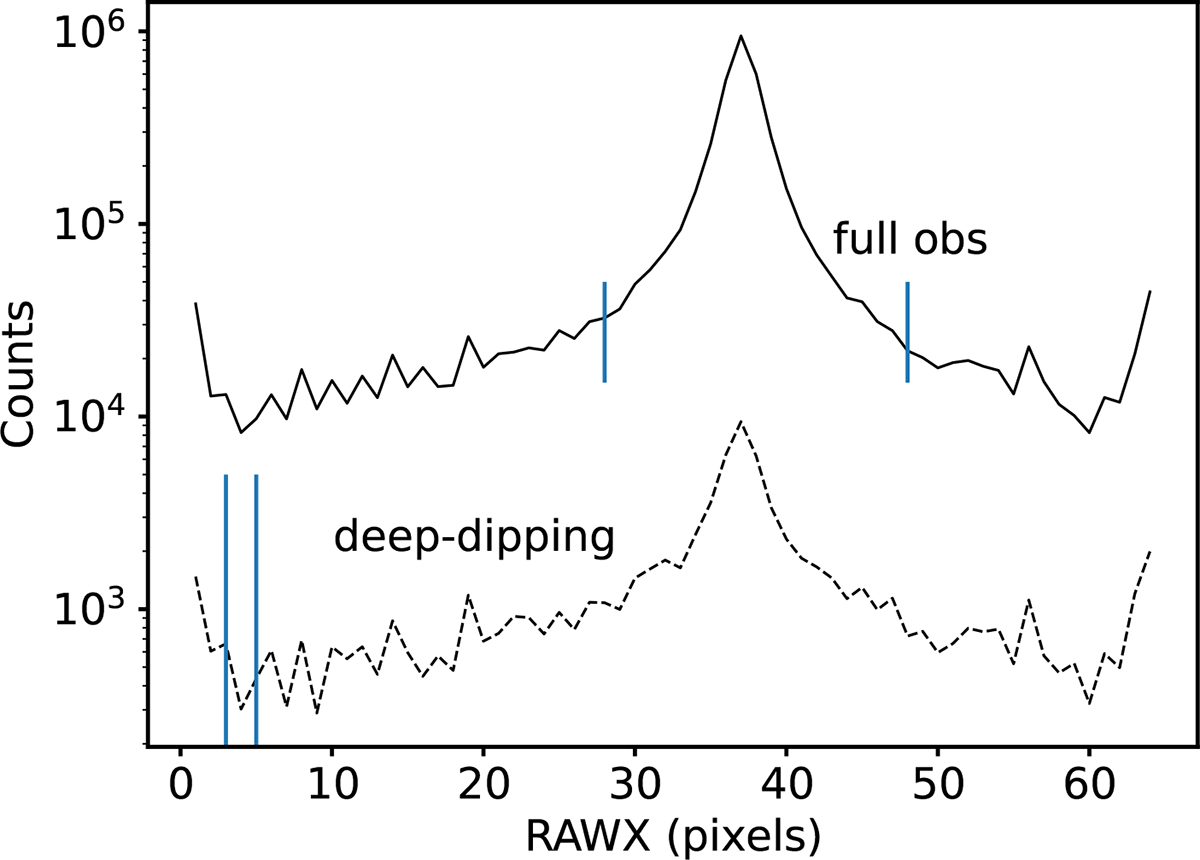
Fig. 2.
Download original image
Histogram of the total number of photons counts vs. RAWX for the original event file of the full observation (solid line) and for the event file from the deep-dipping time interval (dotted line). The defined source region RAWX = [28−48] and background region RAWX = [3−5] are indicated with vertical lines. The plot shows the background contamination by the source emission displayed by the difference in counts around the wings of the distributions. Data shown for Obs. 301.
Current usage metrics show cumulative count of Article Views (full-text article views including HTML views, PDF and ePub downloads, according to the available data) and Abstracts Views on Vision4Press platform.
Data correspond to usage on the plateform after 2015. The current usage metrics is available 48-96 hours after online publication and is updated daily on week days.
Initial download of the metrics may take a while.