Fig. 3.
Download original image
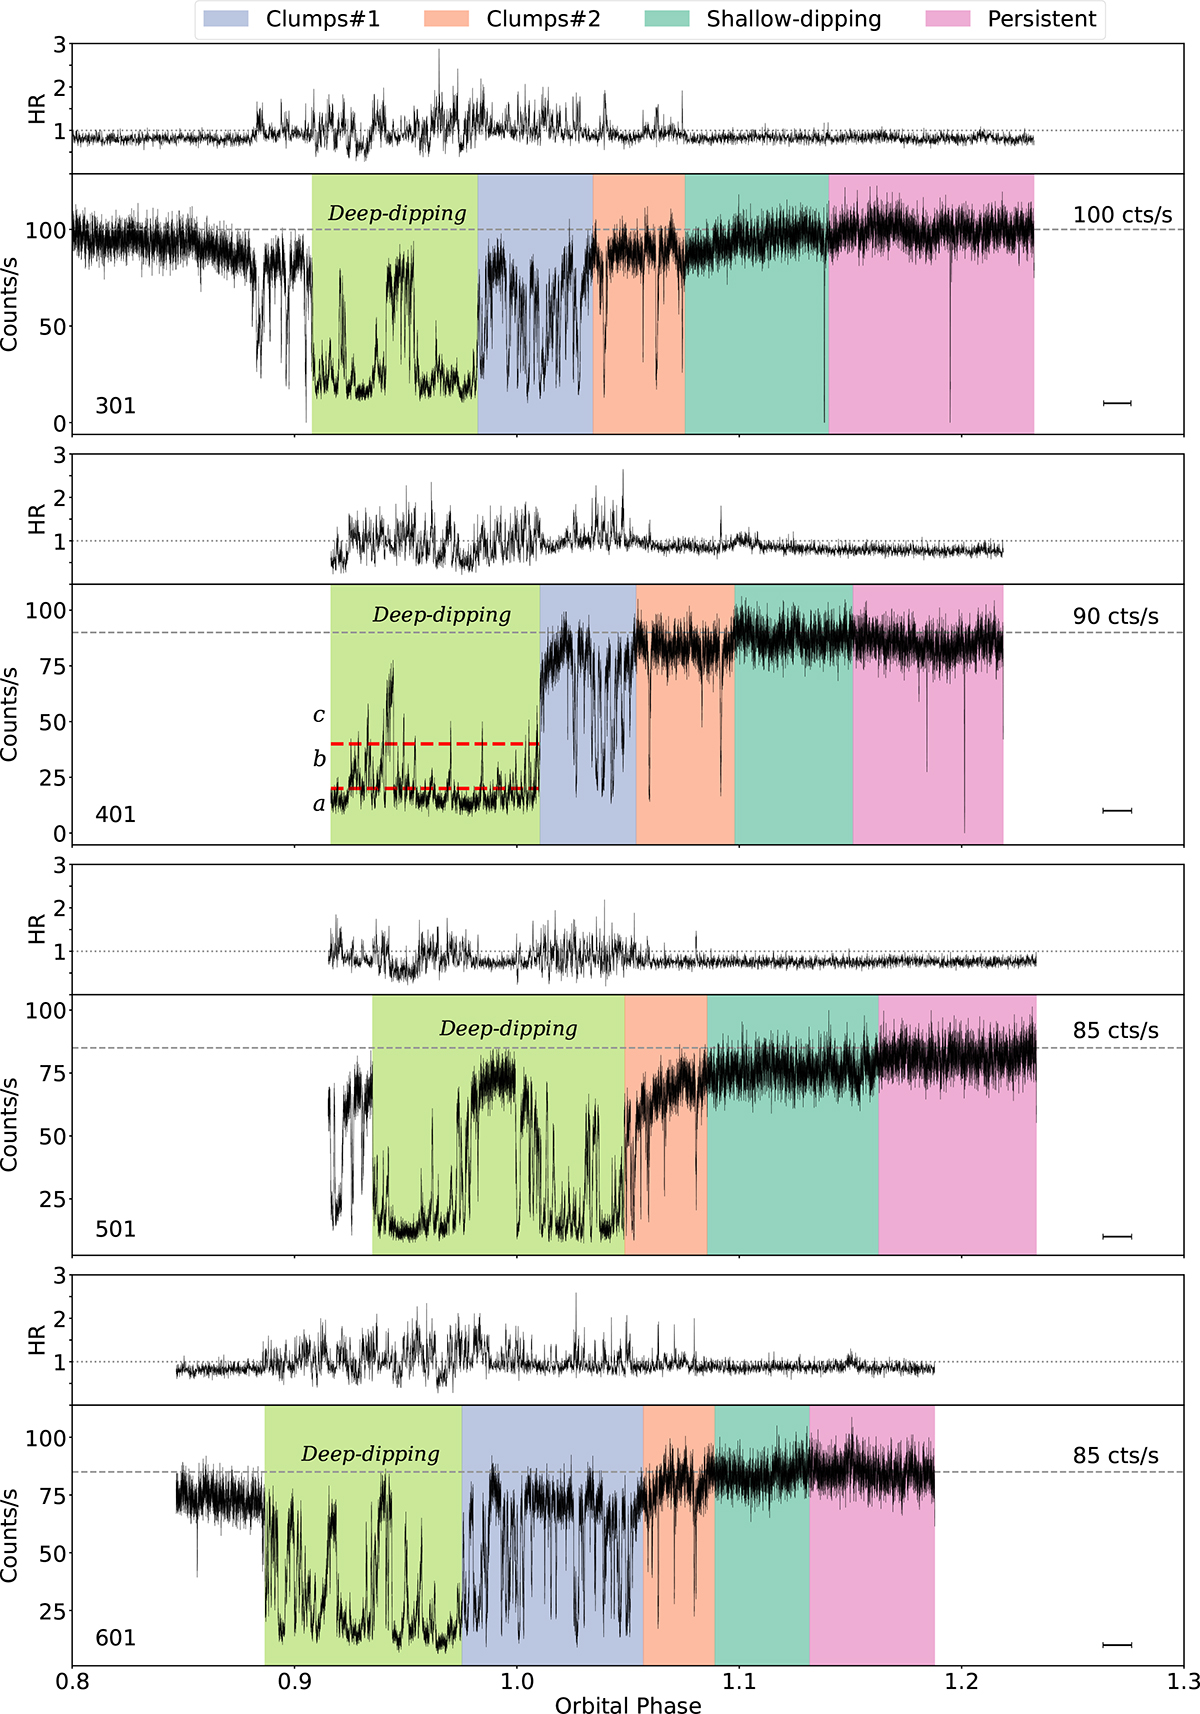
Phase-folded light curves of all EPIC pn observations based on the ephemeris from Smale et al. (2001). Phase 0 is defined as the center of the dip. The uncertainty on the phase due to error propagation of the ephemeris is displayed as an error bar in the bottom right corner of each plot. All light curves are 0.3−10 keV and have a 5s time binning. In the top panel of each plot, the hardness ratios (5−10 keV/1.7−5 keV) for each observation are shown. The average persistent count rate is indicated as a dashed line in each light curve. The time intervals selected for the time-resolved analysis are shown for all observations: Clumps 1, clumps 2, shallow dipping, and persistent dipping (light blue, orange, dark green, and pink, respectively; see also Sect. 3.1). The duration of the deep-dipping interval is shown in all observations (light green). The intensity ranges for the flux-resolved analysis of the deep dipping in Obs. 401 are also indicated (a, b, and c); see Sect. 3.4.
Current usage metrics show cumulative count of Article Views (full-text article views including HTML views, PDF and ePub downloads, according to the available data) and Abstracts Views on Vision4Press platform.
Data correspond to usage on the plateform after 2015. The current usage metrics is available 48-96 hours after online publication and is updated daily on week days.
Initial download of the metrics may take a while.