Fig. 6.
Download original image
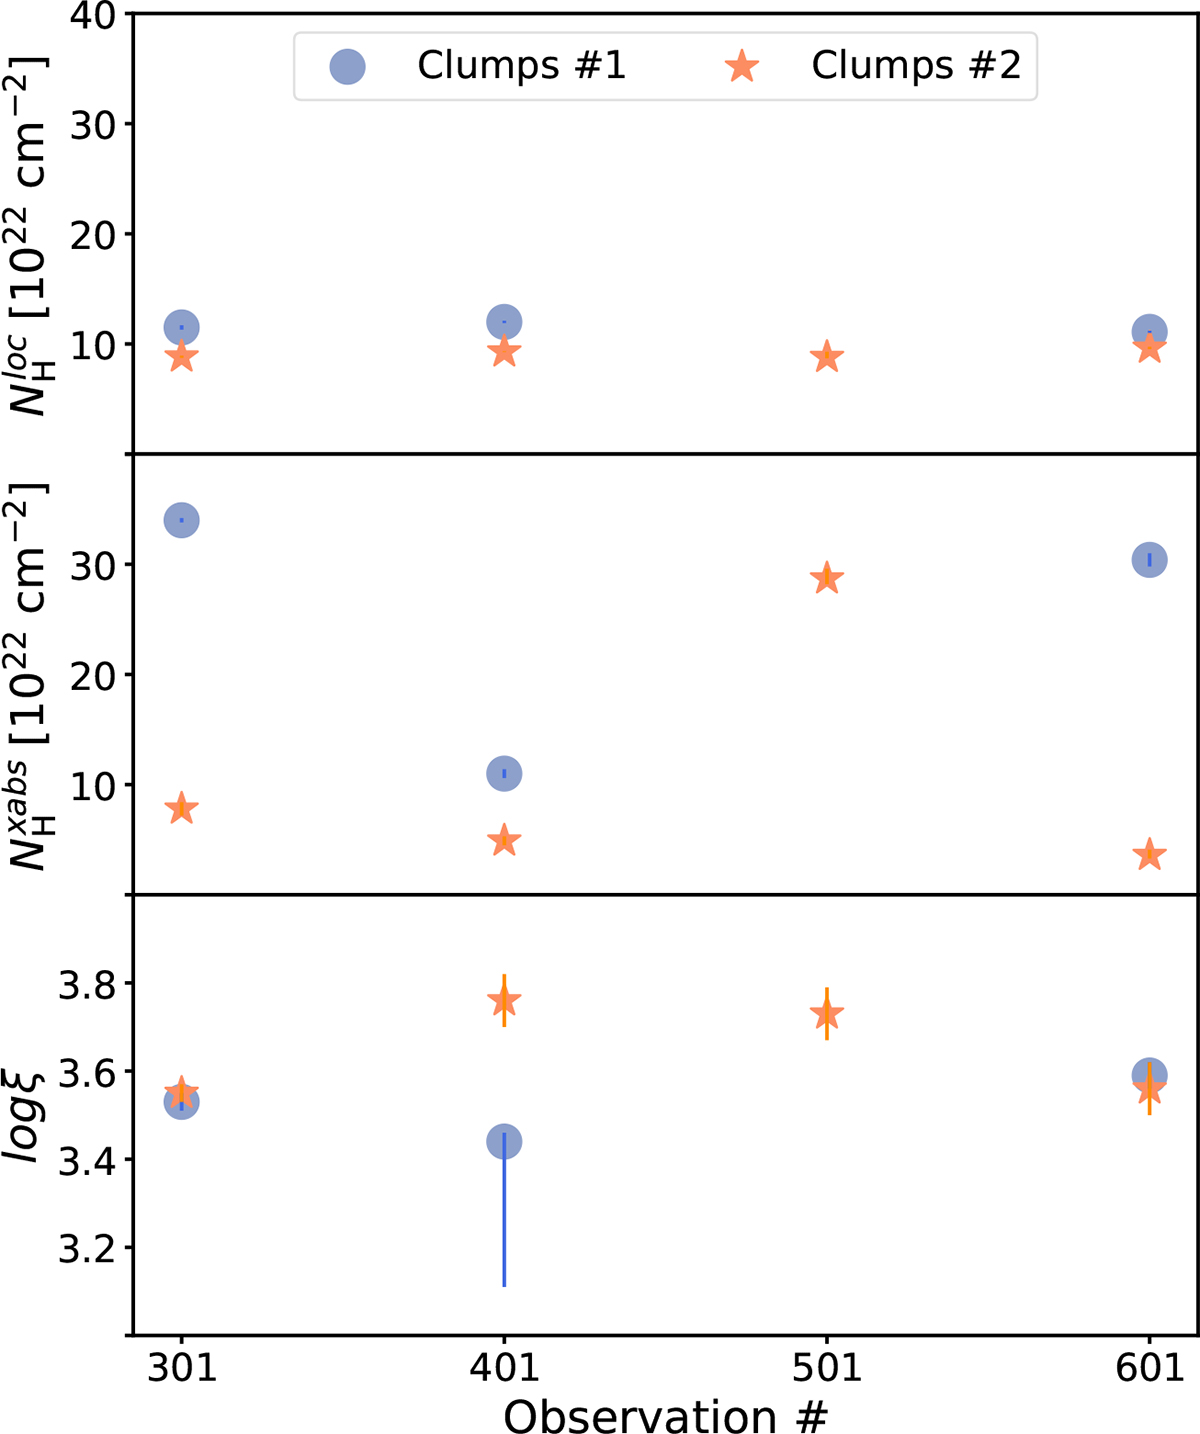
Trends from the spectral results of the clump#1 and clump#2 intervals for all observations (301, 401, 501, and 01). No clumps#1 were identified for Obs. 501 (see Sect. 3.1). From top to bottom: Column density value of the local cold absorption (![]() ), column density value of the ionized absorption (
), column density value of the ionized absorption (![]() ), and ionization of the gas (log ξ). The uncertainty on the values is shown with error bars. When they are absent, the errors are too small to be visualized.
), and ionization of the gas (log ξ). The uncertainty on the values is shown with error bars. When they are absent, the errors are too small to be visualized.
Current usage metrics show cumulative count of Article Views (full-text article views including HTML views, PDF and ePub downloads, according to the available data) and Abstracts Views on Vision4Press platform.
Data correspond to usage on the plateform after 2015. The current usage metrics is available 48-96 hours after online publication and is updated daily on week days.
Initial download of the metrics may take a while.