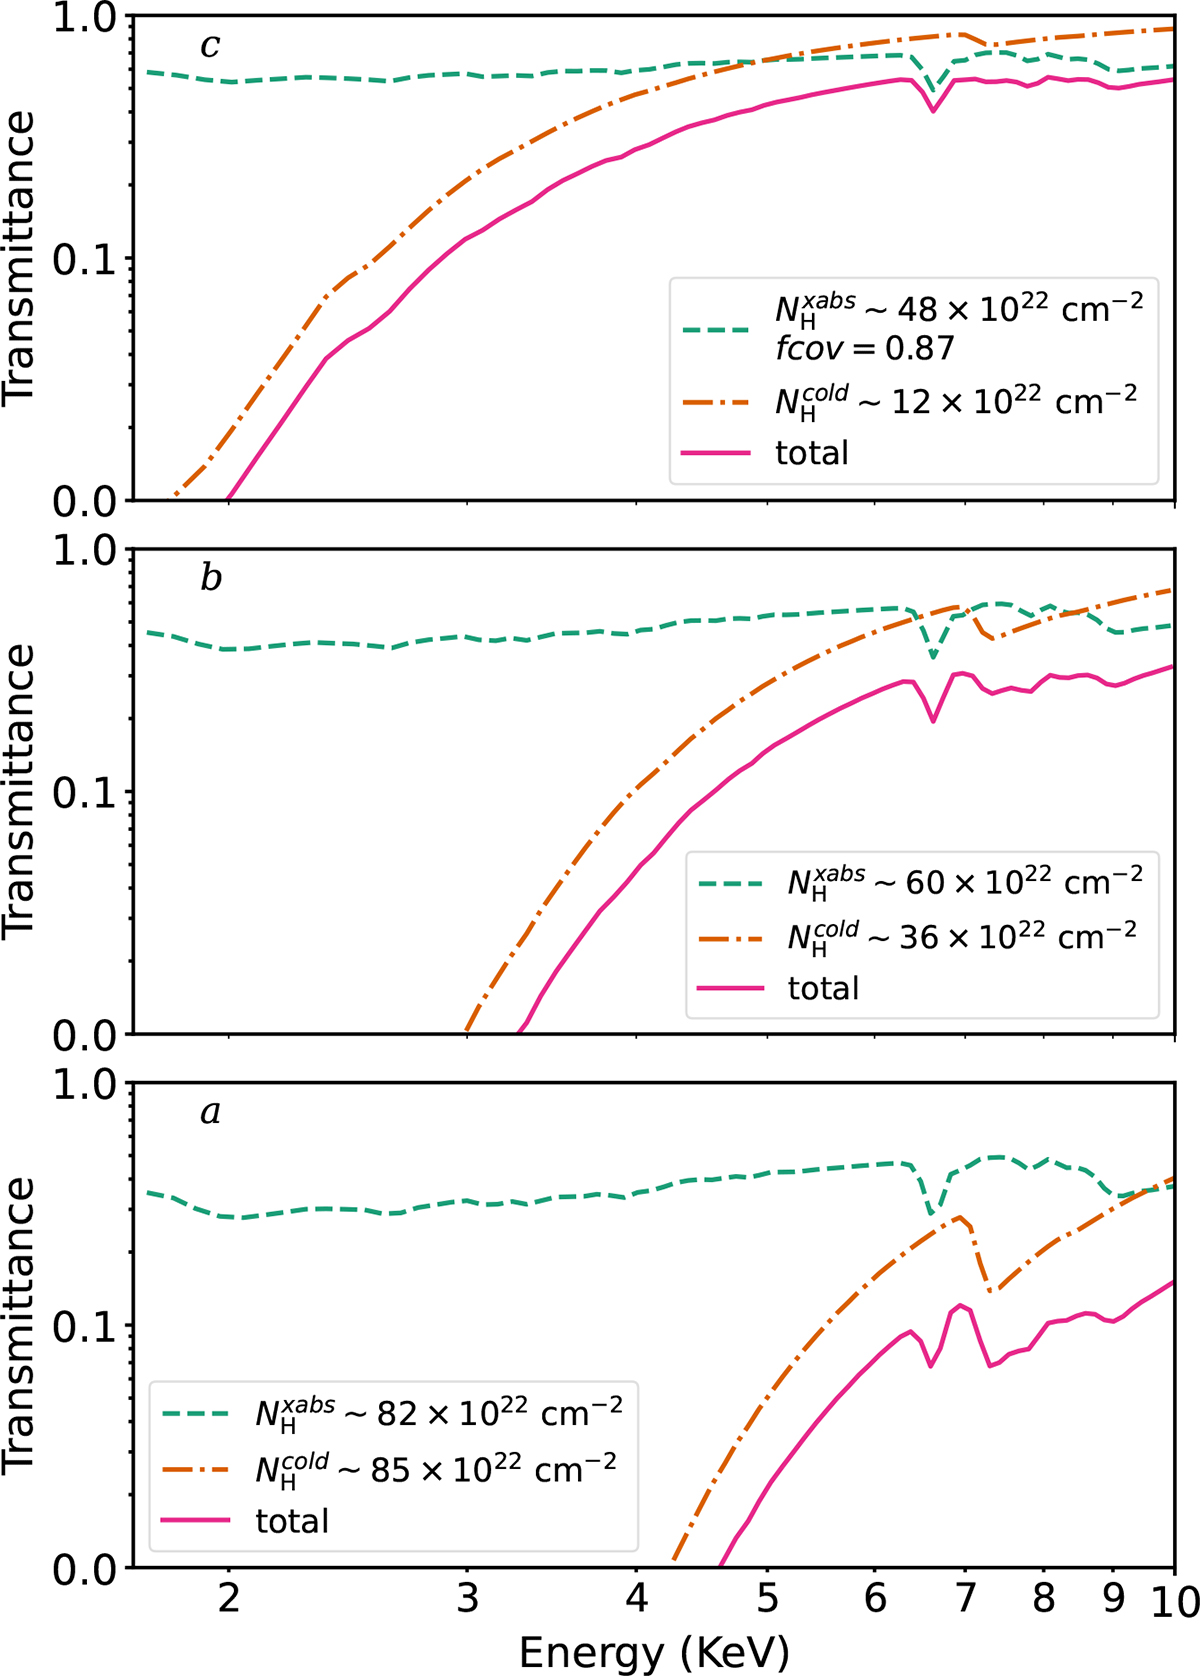
Fig. 8.
Download original image
Transmission plots (absorbed spectrum normalized by the continuum emission) for the direct emission of the flux-resolved spectra of the deep-dipping interval of Obs. 401 (a, b, and c). Each plot shows the transmission of the ionized absorber (xabs, dashed line), absorption from the total amount of cold material (dashed-dotted line), and the total transmission (solid line). All the absorption models were also convolved with the resolution of EPIC pn. The column density of the absorbers is indicated, together with the covering factor (fcov) values. If not indicated, the covering factor has a value of one.
Current usage metrics show cumulative count of Article Views (full-text article views including HTML views, PDF and ePub downloads, according to the available data) and Abstracts Views on Vision4Press platform.
Data correspond to usage on the plateform after 2015. The current usage metrics is available 48-96 hours after online publication and is updated daily on week days.
Initial download of the metrics may take a while.