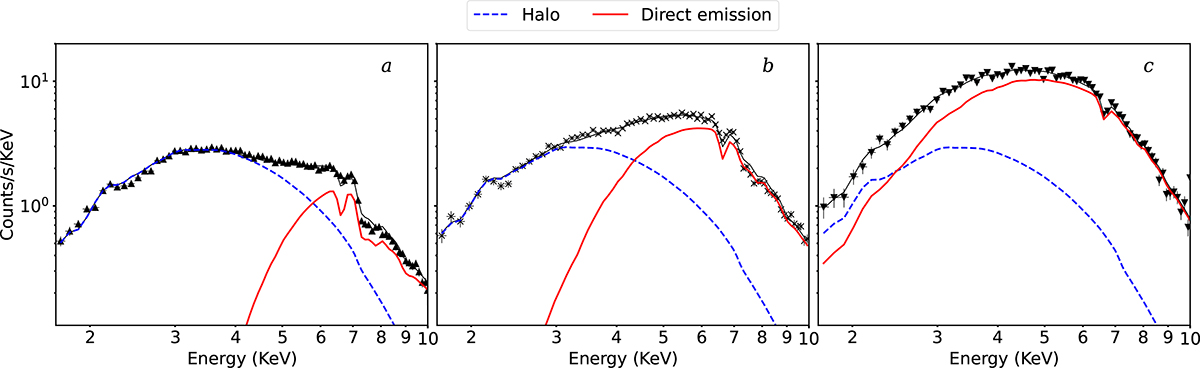
Fig. 9.
Download original image
Model components for the flux-resolved spectra of the deep-dipping interval of Obs. 401 (a, b, and c). We show that the direct and scattered emission (see Fig. 4) dominate for different flux levels. The direct part of the emission is shown in red (solid line), and the halo component is shown in blue (dotted line). The halo contribution in spectra b and a causes the double bumped/flattened shape.
Current usage metrics show cumulative count of Article Views (full-text article views including HTML views, PDF and ePub downloads, according to the available data) and Abstracts Views on Vision4Press platform.
Data correspond to usage on the plateform after 2015. The current usage metrics is available 48-96 hours after online publication and is updated daily on week days.
Initial download of the metrics may take a while.