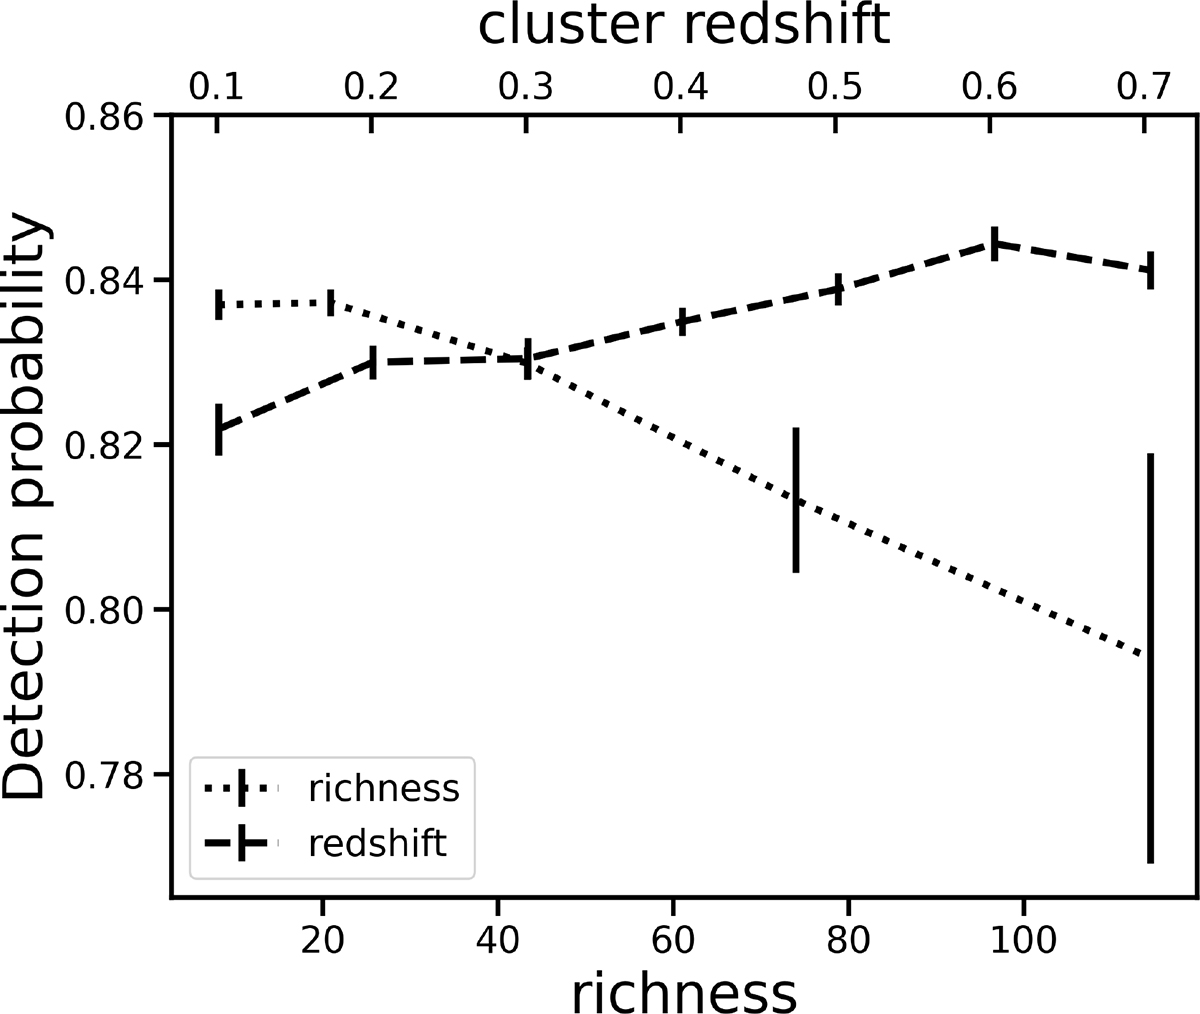
Fig. 2.
Download original image
Detection probability as a function of richness (bottom axis) and redshift (top axis) for the AMICO-DR3 galaxy clusters, shown with dotted and dashed lines, respectively. As the catalogue contains very few clusters with high richness (greater than 70), clusters are divided into five logarithmically spaced richness bins and seven linearly spaced redshift bins. The error bars represent the standard errors of the detection probability.
Current usage metrics show cumulative count of Article Views (full-text article views including HTML views, PDF and ePub downloads, according to the available data) and Abstracts Views on Vision4Press platform.
Data correspond to usage on the plateform after 2015. The current usage metrics is available 48-96 hours after online publication and is updated daily on week days.
Initial download of the metrics may take a while.