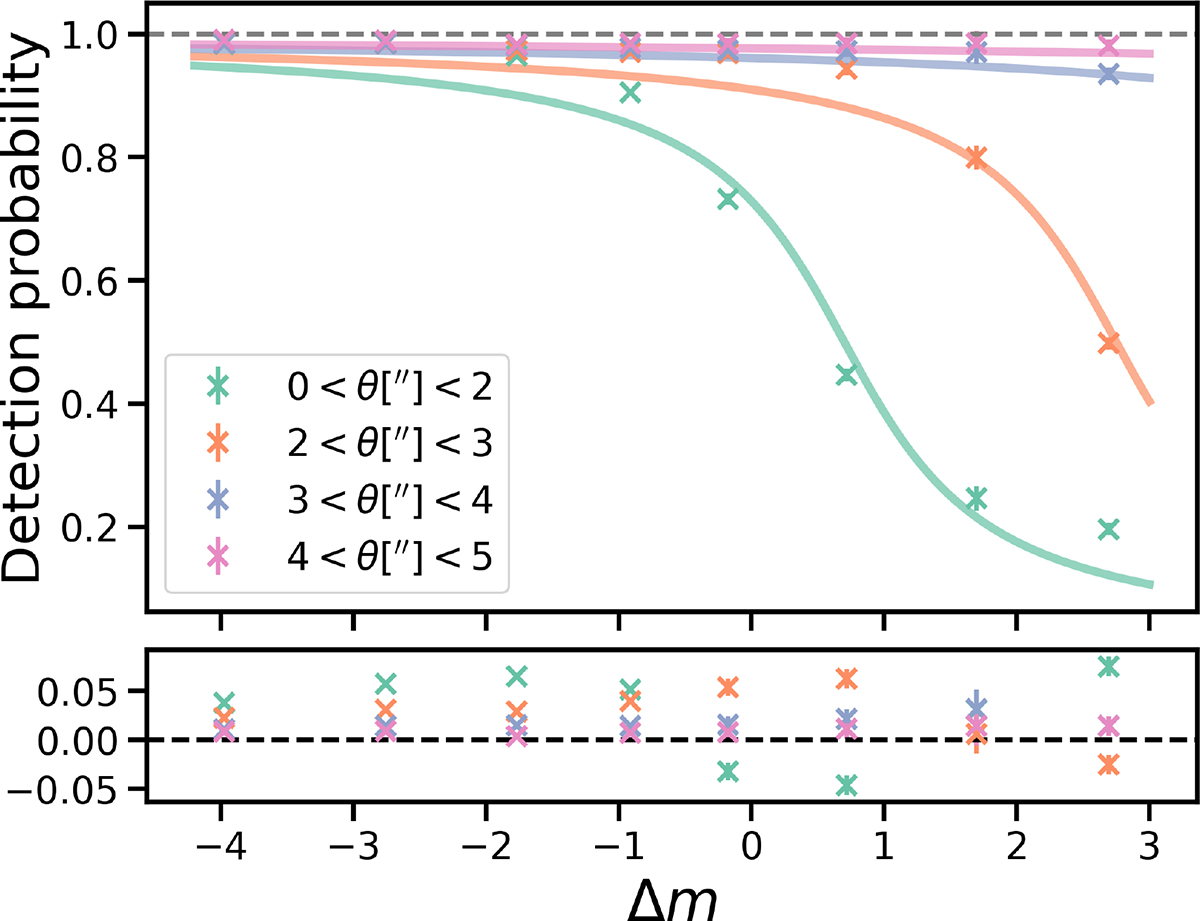
Fig. 4.
Download original image
Upper panel: Detection probability as a function of magnitude difference in four separation bins between 0 and 5 arcseconds, with the fit function (12) plotted for each bin. The detection probability behaviour in higher separation bins coincides with the purple line and is therefore omitted for clarity. Residuals between the model fit and the data points for each separation bin are shown.
Current usage metrics show cumulative count of Article Views (full-text article views including HTML views, PDF and ePub downloads, according to the available data) and Abstracts Views on Vision4Press platform.
Data correspond to usage on the plateform after 2015. The current usage metrics is available 48-96 hours after online publication and is updated daily on week days.
Initial download of the metrics may take a while.