Fig. 2
Download original image
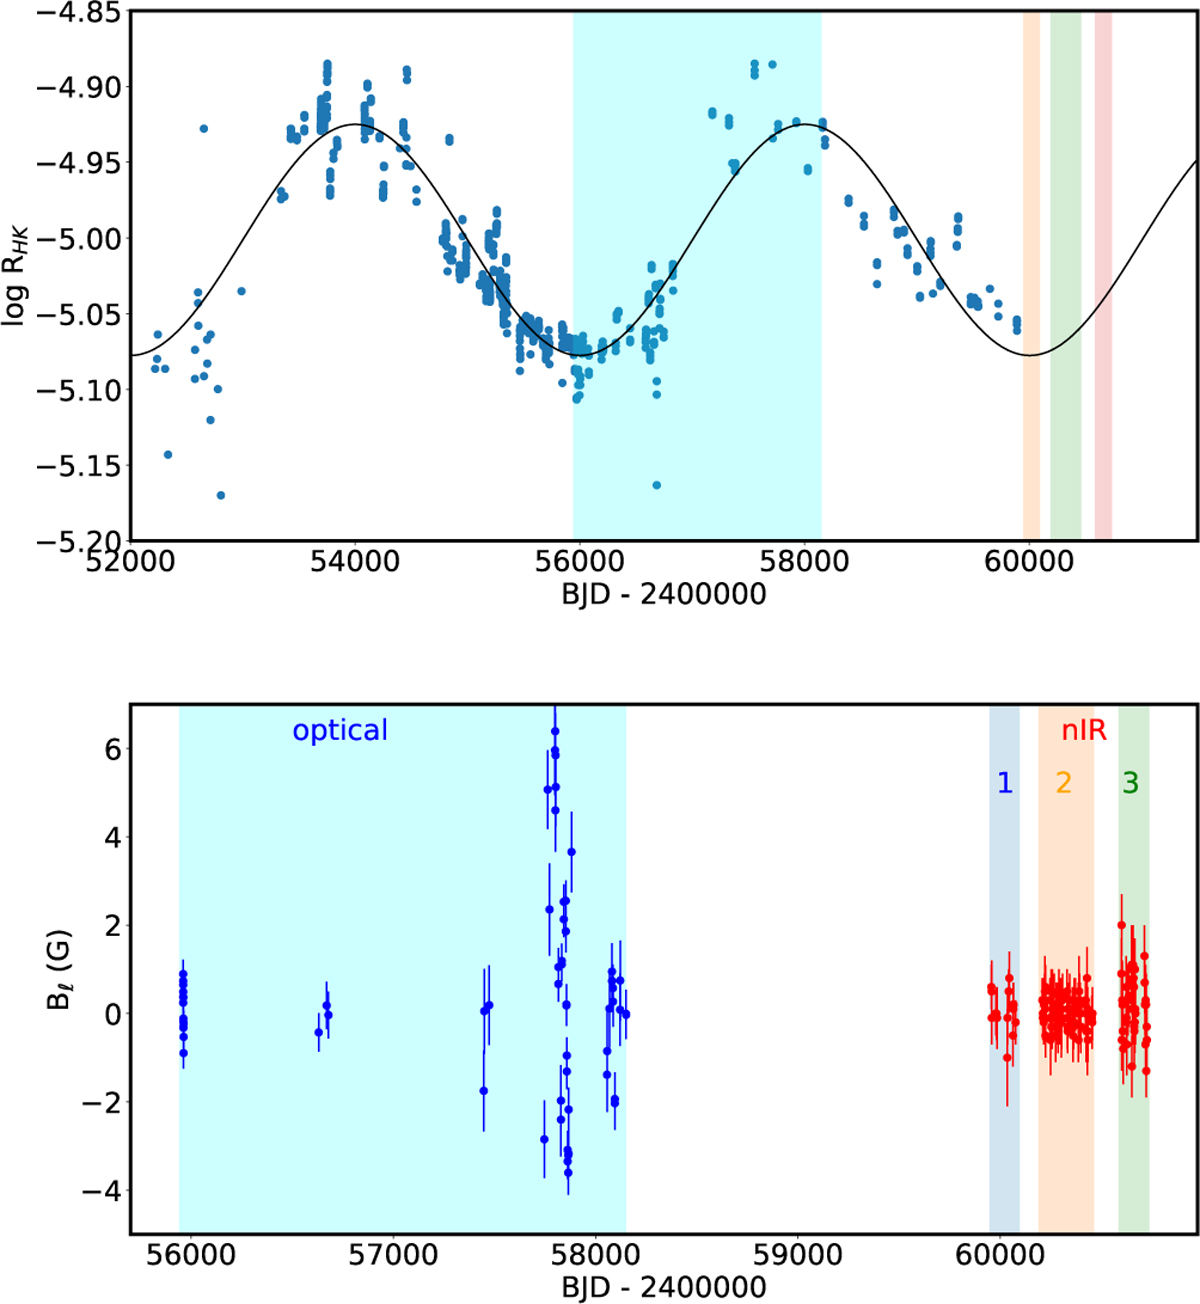
Top: Time variations of the ![]() as measured by optical instruments for 55 Cnc A (Bourrier et al. 2018; Isaacson et al. 2024). The vertical blue (resp. red) lines show the range of optical (resp. nIR) spectropolarimetric campaigns. The best-fit sinusoidal model is over-plotted with a 4003d period. Bottom: Longitudinal field measurements of 55 Cnc A as a function of the Julian date. Blue symbols indicate optical measurements, while red symbols denote nIR observations. The shaded areas represent the different subsets used for ZDI analyses, especially for SPIRou where the three seasons were treated separately (see text). One SPIRou measurement with an error larger than 3 G was removed. Note the different timescales.
as measured by optical instruments for 55 Cnc A (Bourrier et al. 2018; Isaacson et al. 2024). The vertical blue (resp. red) lines show the range of optical (resp. nIR) spectropolarimetric campaigns. The best-fit sinusoidal model is over-plotted with a 4003d period. Bottom: Longitudinal field measurements of 55 Cnc A as a function of the Julian date. Blue symbols indicate optical measurements, while red symbols denote nIR observations. The shaded areas represent the different subsets used for ZDI analyses, especially for SPIRou where the three seasons were treated separately (see text). One SPIRou measurement with an error larger than 3 G was removed. Note the different timescales.
Current usage metrics show cumulative count of Article Views (full-text article views including HTML views, PDF and ePub downloads, according to the available data) and Abstracts Views on Vision4Press platform.
Data correspond to usage on the plateform after 2015. The current usage metrics is available 48-96 hours after online publication and is updated daily on week days.
Initial download of the metrics may take a while.