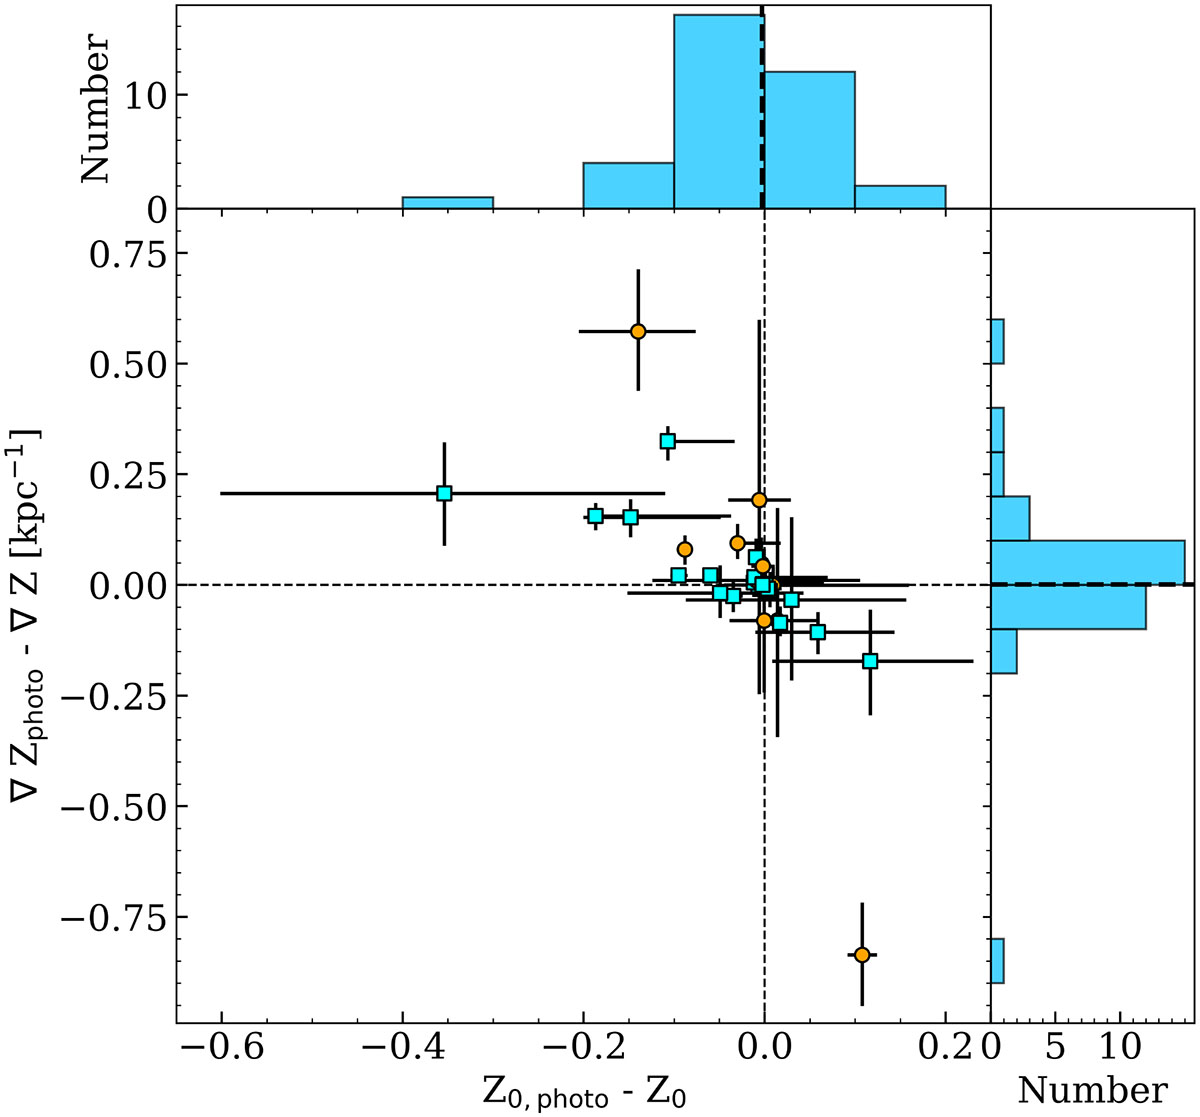
Fig. 10.
Download original image
Ionised-gas metallicity gradients computed when photoionised-only spaxels are used versus when all spaxels are used. The difference between y-intercepts is shown on the x-axis, while the difference between slopes is included on the y-axis. Orange circles (cyan squares) represent the results of the fits to our slow (fast) rotators. The dashed lines in the central plot mark the zero position on each axis. The thick dashed lines in the frequency histograms mark the median value of the data on each axis.
Current usage metrics show cumulative count of Article Views (full-text article views including HTML views, PDF and ePub downloads, according to the available data) and Abstracts Views on Vision4Press platform.
Data correspond to usage on the plateform after 2015. The current usage metrics is available 48-96 hours after online publication and is updated daily on week days.
Initial download of the metrics may take a while.