Fig. 2.
Download original image
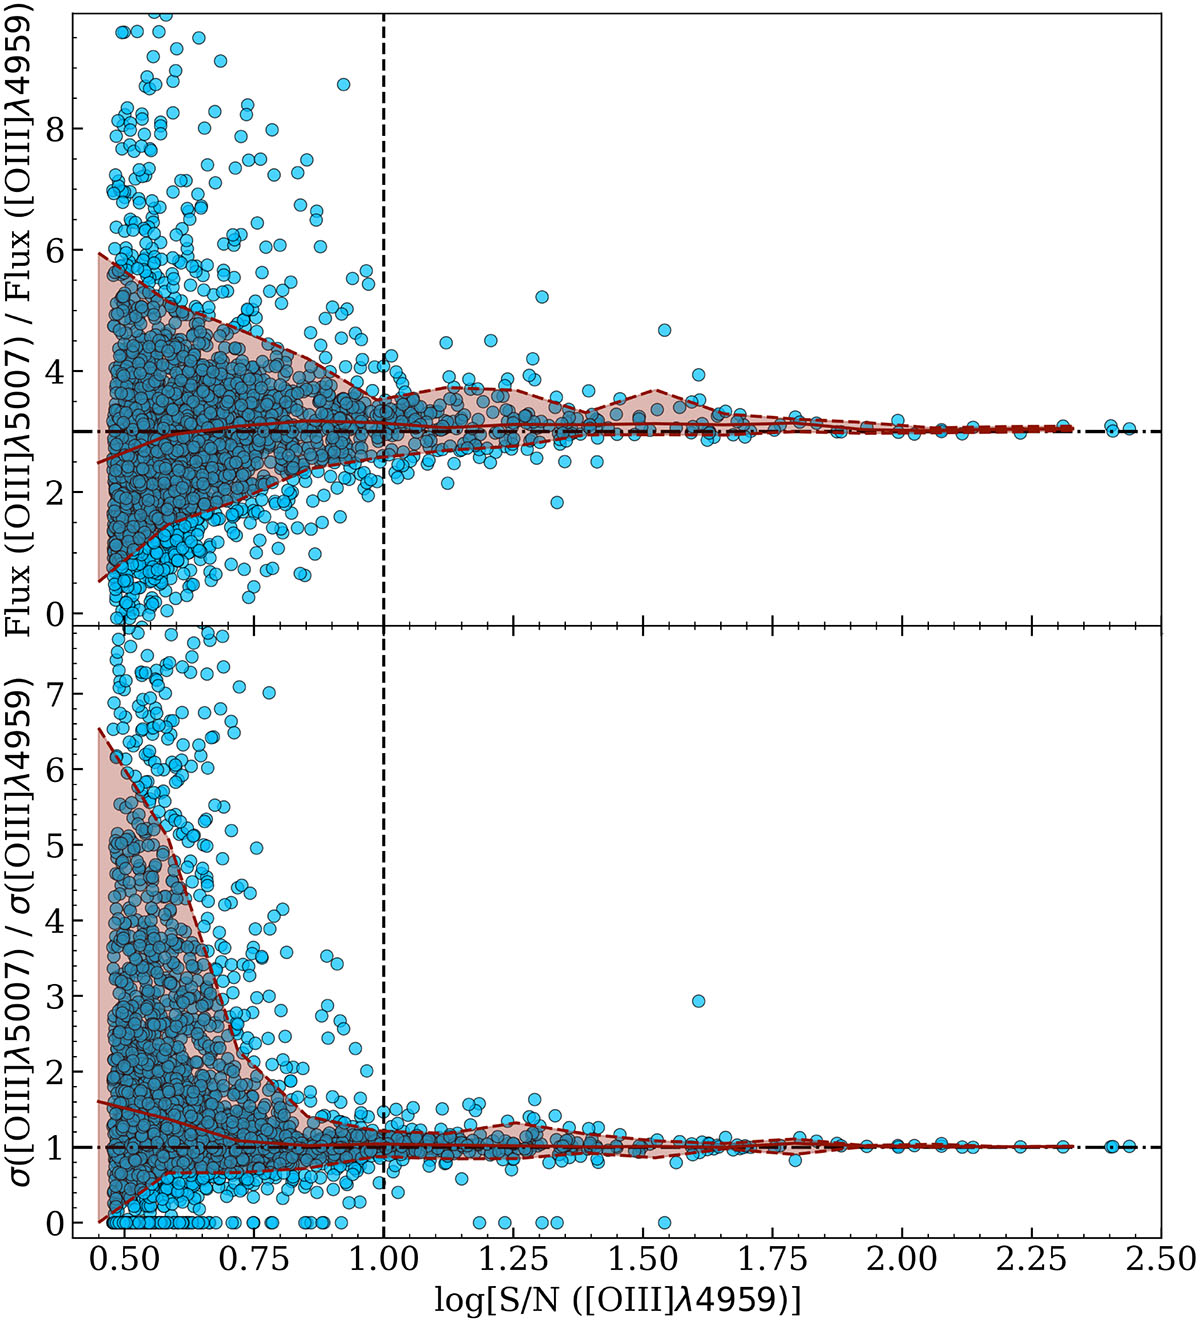
Flux (top panel) and velocity dispersion (bottom panel) ratios of [O III]λ5007 to [O III]λ4959 as a function of the S/N of [O III]λ4959 measured on the peak of the line using all data included in the MEGADES survey. In both cases, the shaded region between the dashed red lines marks the position of the 10th and 90th percentiles. The solid red line indicates the median value of the flux or velocity dispersion ratio at each S/N value.
Current usage metrics show cumulative count of Article Views (full-text article views including HTML views, PDF and ePub downloads, according to the available data) and Abstracts Views on Vision4Press platform.
Data correspond to usage on the plateform after 2015. The current usage metrics is available 48-96 hours after online publication and is updated daily on week days.
Initial download of the metrics may take a while.