Fig. 3.
Download original image
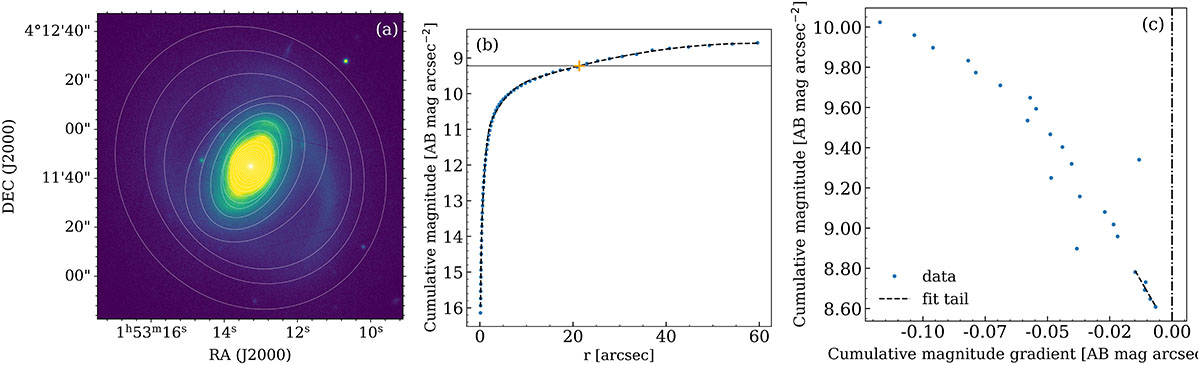
Panel (a): Pan-STARRS g-band image of the galaxy NGC 0718, with the isophotes calculated using Photutils overplotted in white. Panel (b): Cumulative magnitude derived from the previously measured isophotes as a function of the semi-major axis. Blue dots correspond to the integrated magnitude within each isophote, and the dashed black line is a smoothed interpolation of the distribution. The horizontal solid blue line indicates the asymptotic magnitude of the galaxy, and the orange cross marks the semi-major axis at which the cumulative magnitude reaches a value equal to the asymptotic magnitude plus 2.5log(2), corresponding to the effective radius. Panel (c): Cumulative magnitude as a function of the cumulative magnitude gradient. Each blue dot corresponds to a given isophote. The dashed black line shows a linear fit to the data points at the lowest gradients, and the vertical dashed-dotted black line marks the zero gradient. The intercept of the linear fit with the vertical axis is used to estimate the asymptotic magnitude of the galaxy.
Current usage metrics show cumulative count of Article Views (full-text article views including HTML views, PDF and ePub downloads, according to the available data) and Abstracts Views on Vision4Press platform.
Data correspond to usage on the plateform after 2015. The current usage metrics is available 48-96 hours after online publication and is updated daily on week days.
Initial download of the metrics may take a while.