Fig. 4.
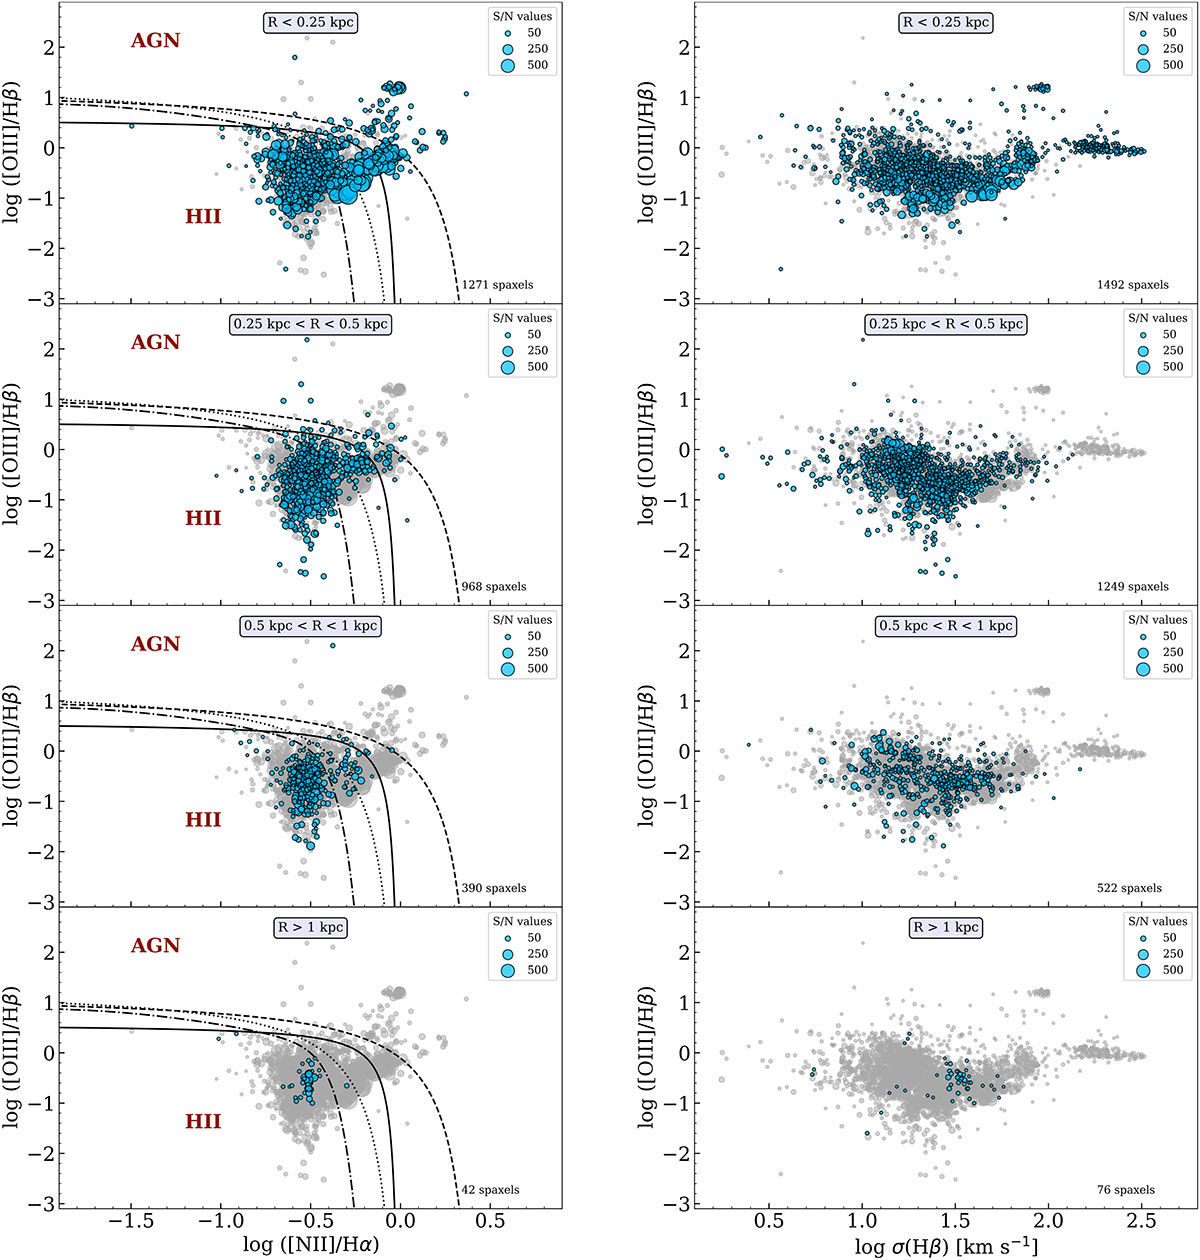
Download original image
Left panels: [O III]λ5007/Hβ versus [N II]λ6584/Hα BPT diagram of all spaxels in the MEGADES sample for galactocentric distance cuts of (from top to bottom): < 0.25 kpc, between 0.25 and 0.5 kpc, between 0.5 and 1 kpc, and > 1 kpc. The size of each point depends on the S/N measured at the peak of the [N II]λ6584 line. The dashed, dotted, dash-dotted, and solid lines represent the Kewley et al. (2001), Kauffmann et al. (2003), Stasińska et al. (2006), and Espinosa-Ponce et al. (2020) demarcation curves, respectively. Right panels: Relationship between [O III]λ5007/Hβ and the velocity dispersion measured on the Hβ line for the same galactocentric distances shown in the left panels. The size of each point depends on the S/N measured at the peak of the Hβ line. Grey dots in the backgrounds correspond to all points in the sample.
Current usage metrics show cumulative count of Article Views (full-text article views including HTML views, PDF and ePub downloads, according to the available data) and Abstracts Views on Vision4Press platform.
Data correspond to usage on the plateform after 2015. The current usage metrics is available 48-96 hours after online publication and is updated daily on week days.
Initial download of the metrics may take a while.