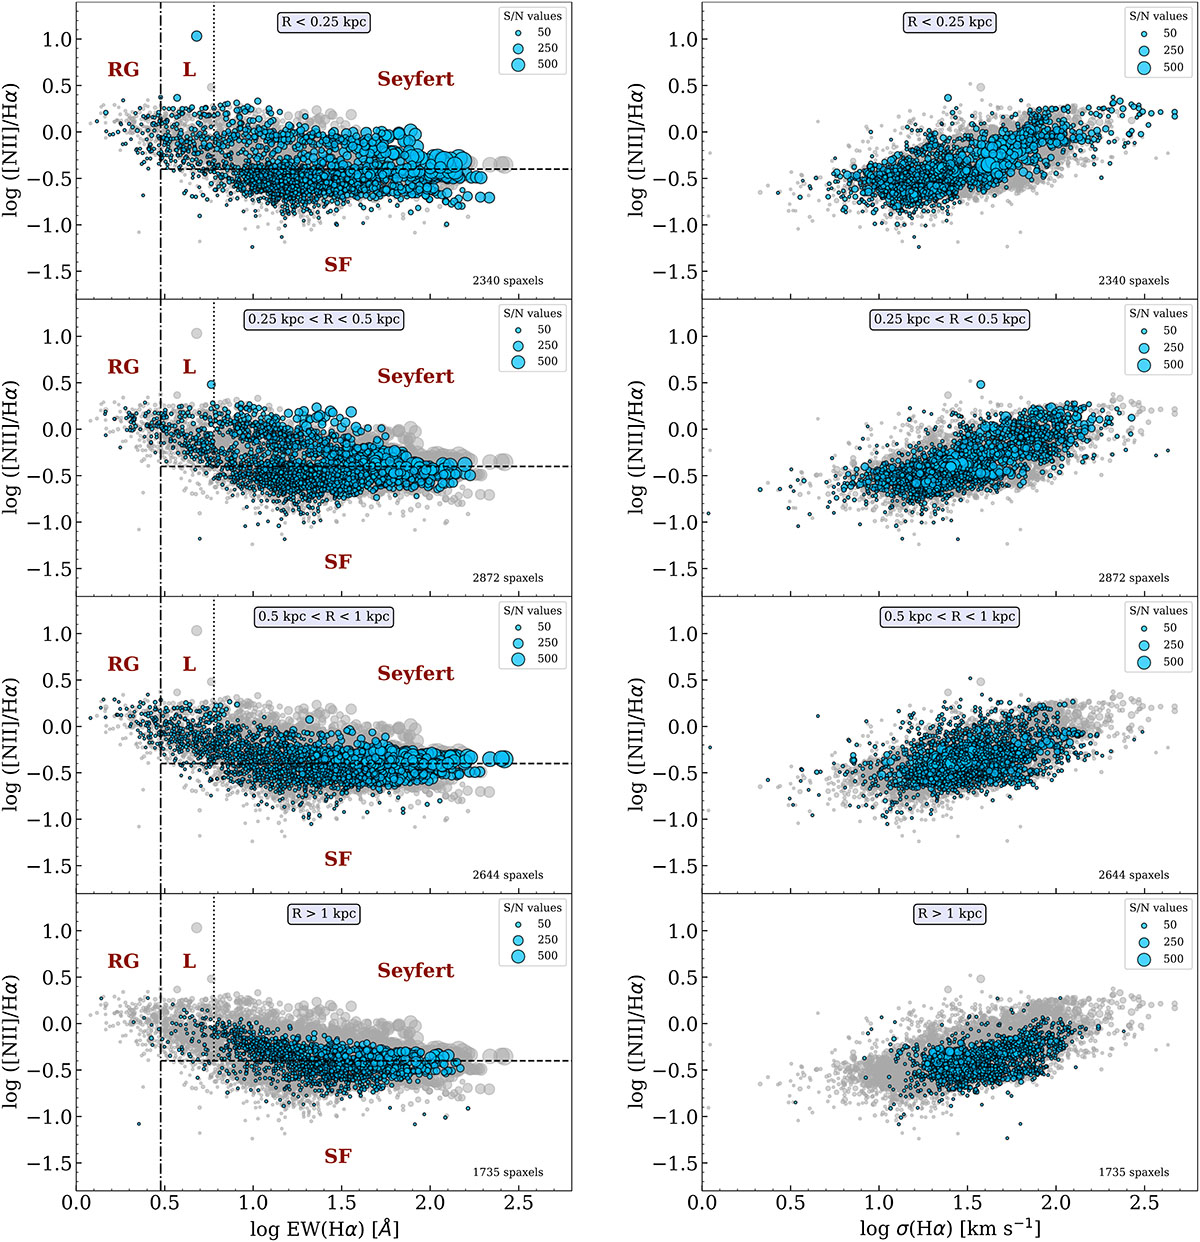
Fig. 5.
Download original image
Left panels: [N II]λ6584/Hα versus the equivalent width of the Hα line for different galactocentric distance cuts (from top to bottom): < 0.25 kpc, between 0.25 and 0.5 kpc, between 0.5 and 1 kpc, and > 1 kpc. The dashed line marks the boundary proposed by Stasińska et al. (2006) to distinguish between star-forming regions (labelled SF) and AGNs. The dotted line indicates the boundary established by Kewley et al. (2006) to separate, within the AGN area, Seyferts from LINERs (labelled L). The dash-dotted line separates the region populated by lines produced in RGs proposed by Cid Fernandes et al. (2011). Right panels: [N II]λ6584/Hα versus velocity dispersion of the Hα line for the same galactocentric distance cuts. In all panels, the size of each point depends on the S/N measured at the peak of the [N II]λ6584 line. Grey dots in the background correspond to all points in the sample.
Current usage metrics show cumulative count of Article Views (full-text article views including HTML views, PDF and ePub downloads, according to the available data) and Abstracts Views on Vision4Press platform.
Data correspond to usage on the plateform after 2015. The current usage metrics is available 48-96 hours after online publication and is updated daily on week days.
Initial download of the metrics may take a while.