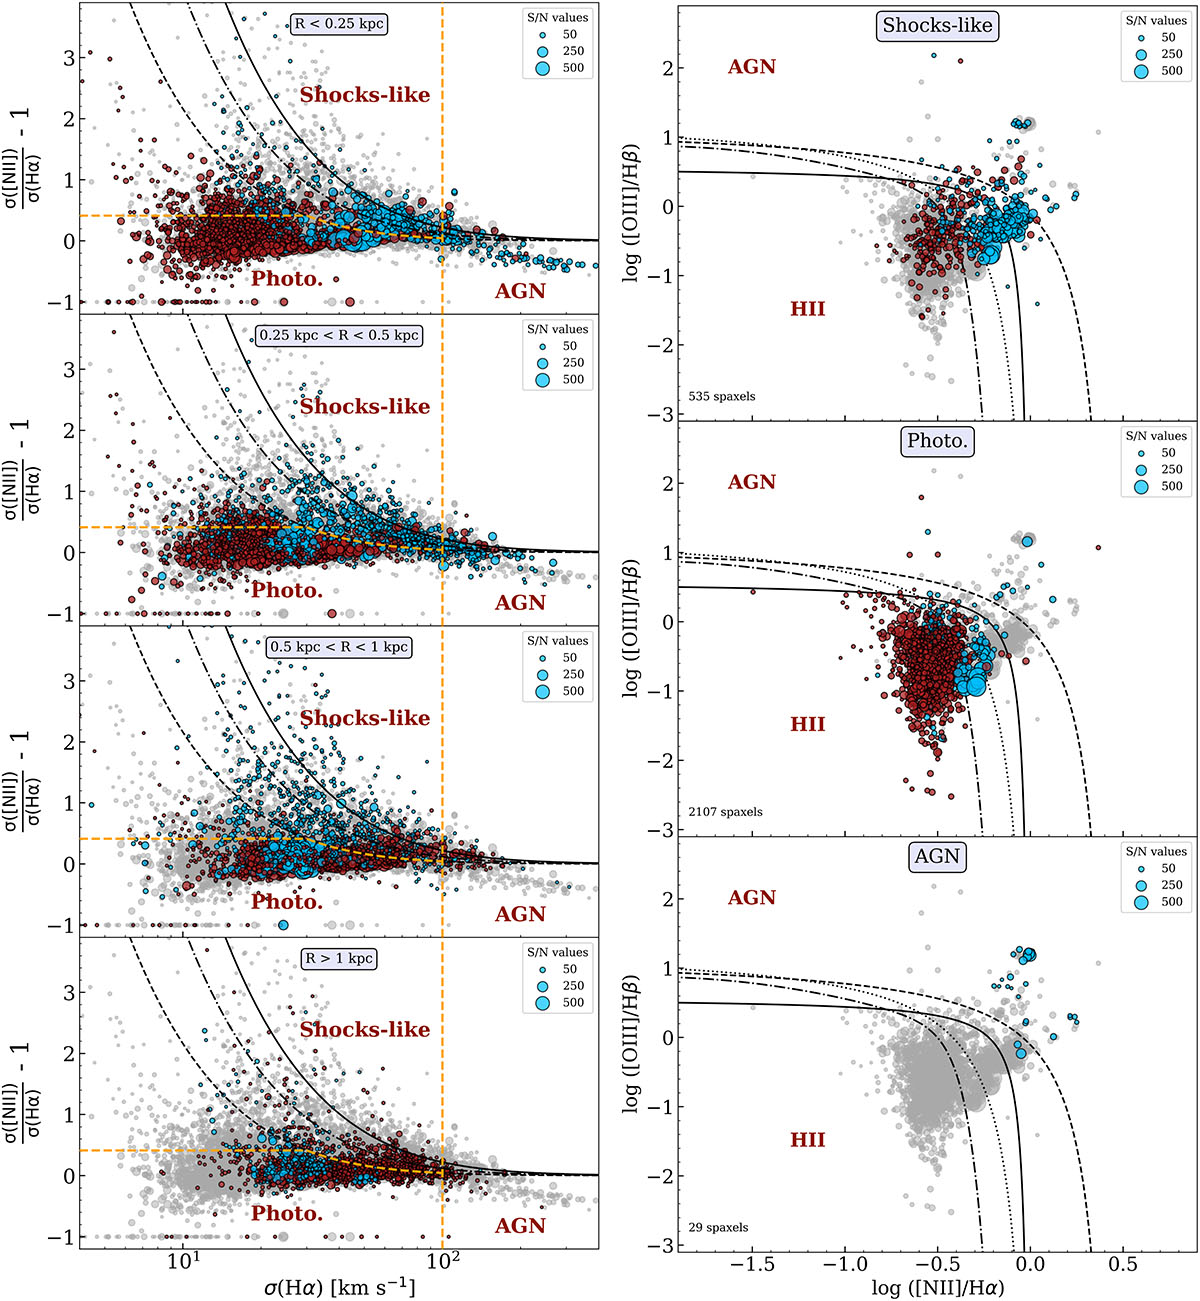
Fig. 7.
Download original image
Left panels: Relationship between the measured ratio of velocity dispersions of [N II]λ6584 and Hα lines versus the velocity dispersion on the Hα line for different galactocentric distance cuts. The dashed, dash-dotted, and solid black curves represent lines with a constant broadening with respect to the Hα line of 30, 50, and 70 km s−1, respectively. The dashed orange lines indicate the boundaries between the regions defined by the dynamic selection of excitation mechanisms explained in this section. Right panels: BPT diagram of [O III]λ5007/Hβ versus [N II]λ6584/Hα corresponding to the points falling within each of the regions defined in the left panel. From top to bottom we have the BPT diagram for the lines excited by shocks-like mechanism, photoionisation, and AGNs. The dashed, dotted, dash-dotted, and solid lines represent the Kewley et al. (2001), Kauffmann et al. (2003), Stasińska et al. (2006), and Espinosa-Ponce et al. (2020) demarcation curves, respectively. In both panels blue dots denote lines measured in galaxies classified as Seyfert or LINER (see Table A.1), while the red dots represents the rest of the galaxies. The size of the points depends on the S/N measured at the peak of the [N II]λ6584 line. Grey dots in the backgrounds correspond to all points in the sample.
Current usage metrics show cumulative count of Article Views (full-text article views including HTML views, PDF and ePub downloads, according to the available data) and Abstracts Views on Vision4Press platform.
Data correspond to usage on the plateform after 2015. The current usage metrics is available 48-96 hours after online publication and is updated daily on week days.
Initial download of the metrics may take a while.