Fig. 8.
Download original image
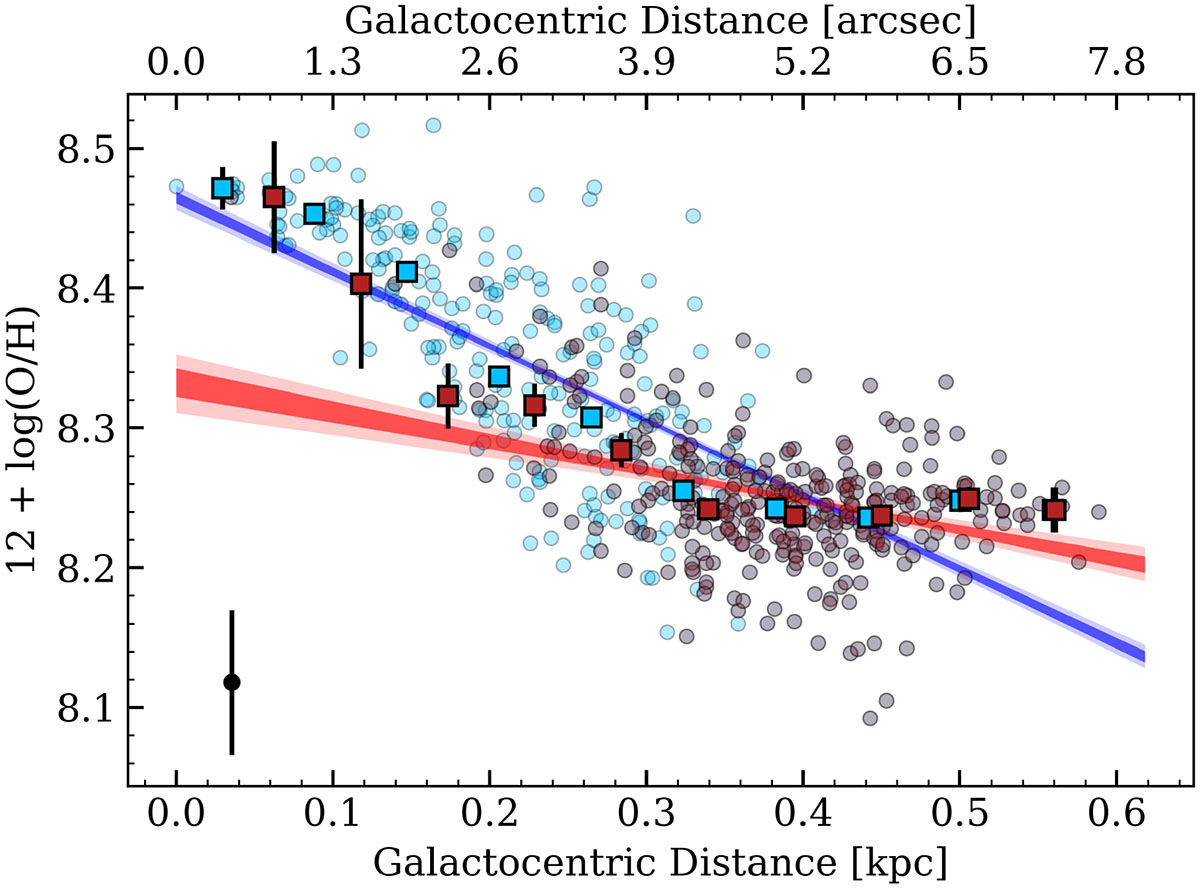
Oxygen abundance (i.e. 12 + log(O/H)) estimations based in the calibration by Marino et al. (2013) as a function of galactocentric distance for the galaxy NGC 3982. Gradients have been derived using the median values estimated for different galactocentric distance intervals. Within each galactocentric distance interval, the median values of the data are represented by blue or red squares. The blue (red) dots represent metallicity measurements obtained from all the spaxels (spaxels whose emission lines originated in star-forming regions; see text). The blue and red bands indicate the results of our Bayesian linear best fits to the data with the same colour coding as for the individual measurements. The dark and light shaded bands correspond to the confidence intervals at 1σ and 2σ levels, respectively. The black dot at the bottom left represents the median error of all the blue points.
Current usage metrics show cumulative count of Article Views (full-text article views including HTML views, PDF and ePub downloads, according to the available data) and Abstracts Views on Vision4Press platform.
Data correspond to usage on the plateform after 2015. The current usage metrics is available 48-96 hours after online publication and is updated daily on week days.
Initial download of the metrics may take a while.