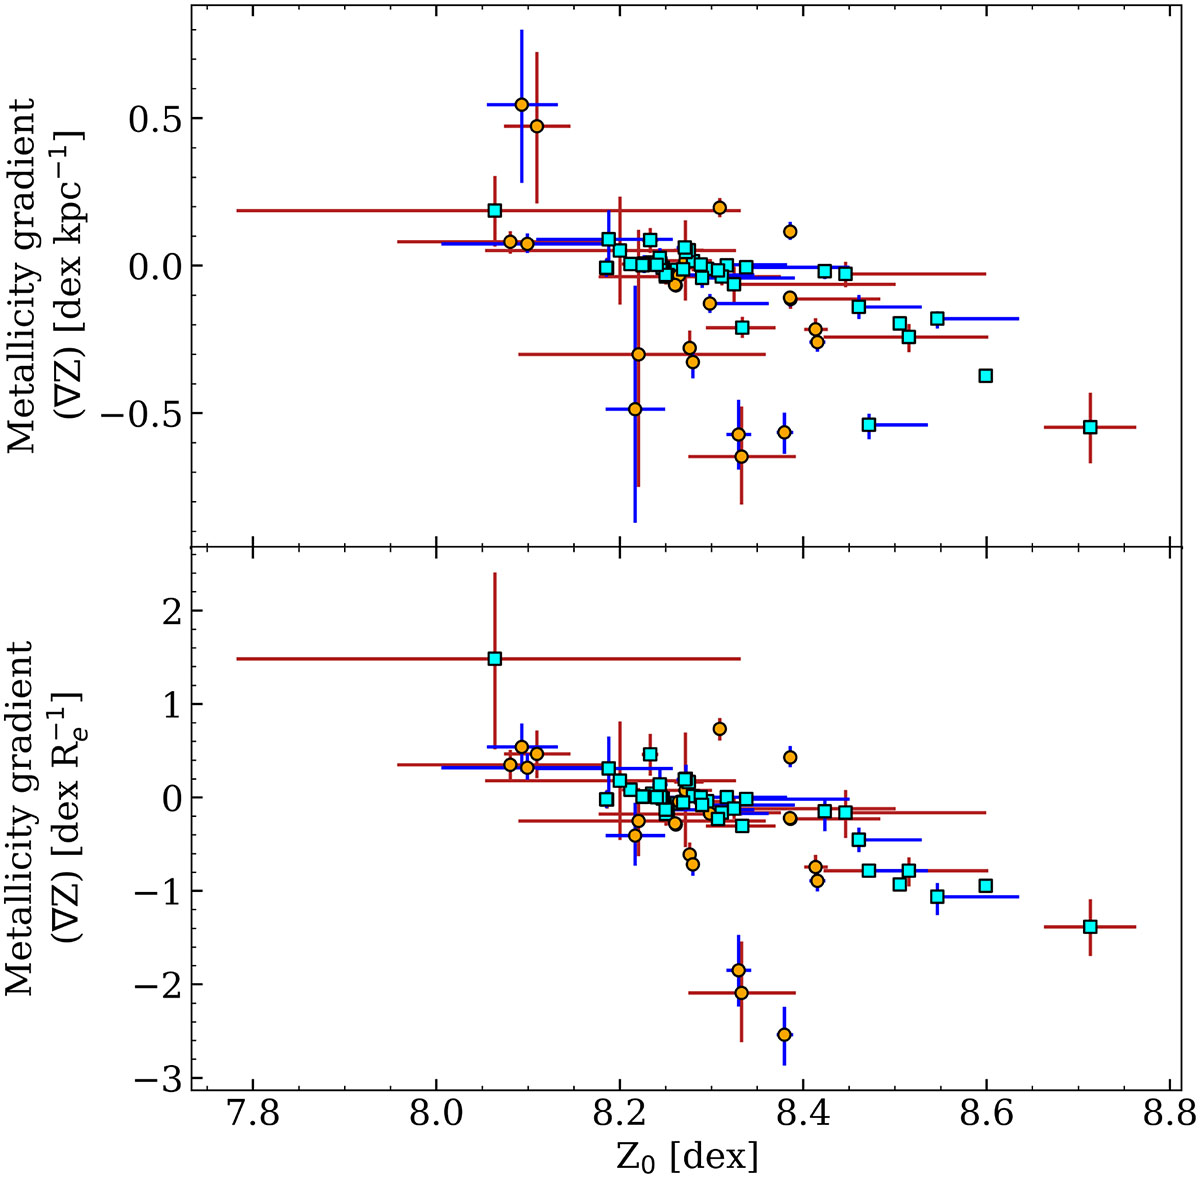
Fig. 9.
Download original image
Metallicity gradients of the ionised gas measured for all galaxies in our sample. The orange circles indicate galaxies that were classified as slow rotators (dynamical classes 1 and 2) and cyan squares indicate fast rotators (classes 3 through 5). Top panel: Gradients computed as a function of galactocentric distance (in kpc). Bottom panel: Gradients computed as a function of the effective radius. The x-axis indicates the y-intercept of the linear fit to the metallicity gradient. Each galaxy is represented twice as we include the results of the best fits obtained using both photoionised spaxels (points with red error bars) and all spaxels (points with blue error bars).
Current usage metrics show cumulative count of Article Views (full-text article views including HTML views, PDF and ePub downloads, according to the available data) and Abstracts Views on Vision4Press platform.
Data correspond to usage on the plateform after 2015. The current usage metrics is available 48-96 hours after online publication and is updated daily on week days.
Initial download of the metrics may take a while.