Fig. 1
Download original image
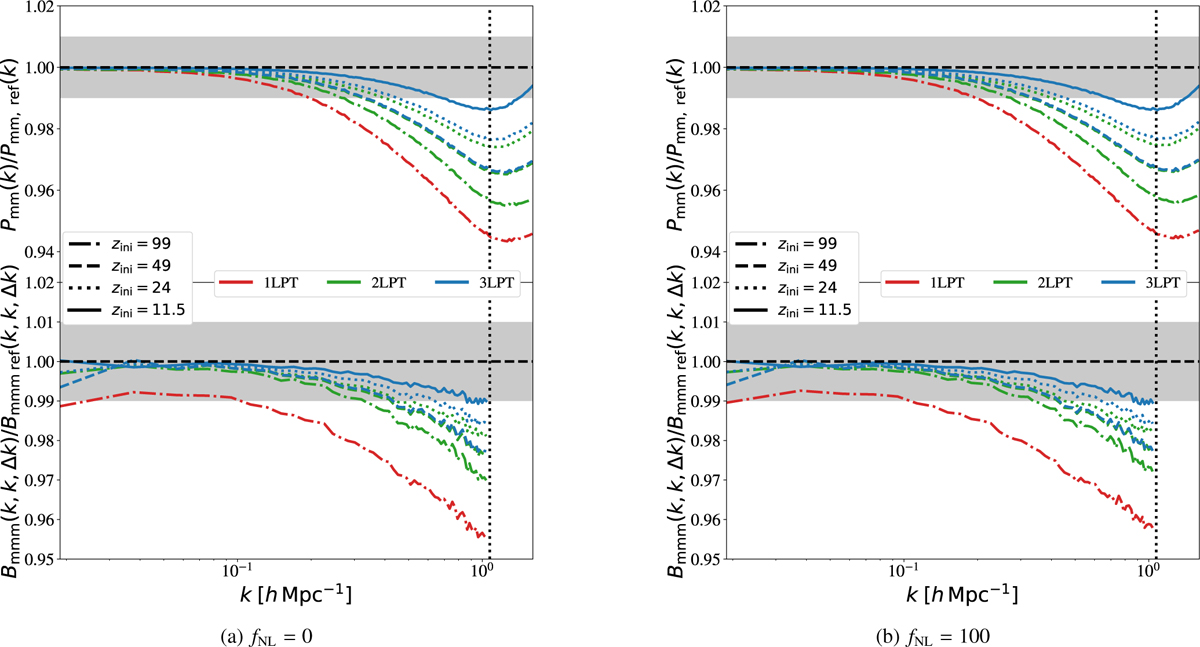
Comparison at z = 0 of the matter power spectrum (upper panels) and bispectrum (lower panels, squeezed limit (k1 = k2 = k; k3 = 3kf)) with respect a high-resolution reference simulation (see Section 3.3). The left panel shows the results for fNL = 0 simulations, and the right panel for those with fNL = 100. The line colour encodes the LPT order used for the initial conditions (red: 1LPT, green: 2LPT, and blue: 3LPT), while the line styles indicate the initial redshift. The shaded regions indicate the ±1% around the reference simulation. The results are nearly identical for fNL = 0 and fNL = 100. A later start using higher-order LPT schemes improves the agreement with the higher-resolution reference simulations.
Current usage metrics show cumulative count of Article Views (full-text article views including HTML views, PDF and ePub downloads, according to the available data) and Abstracts Views on Vision4Press platform.
Data correspond to usage on the plateform after 2015. The current usage metrics is available 48-96 hours after online publication and is updated daily on week days.
Initial download of the metrics may take a while.