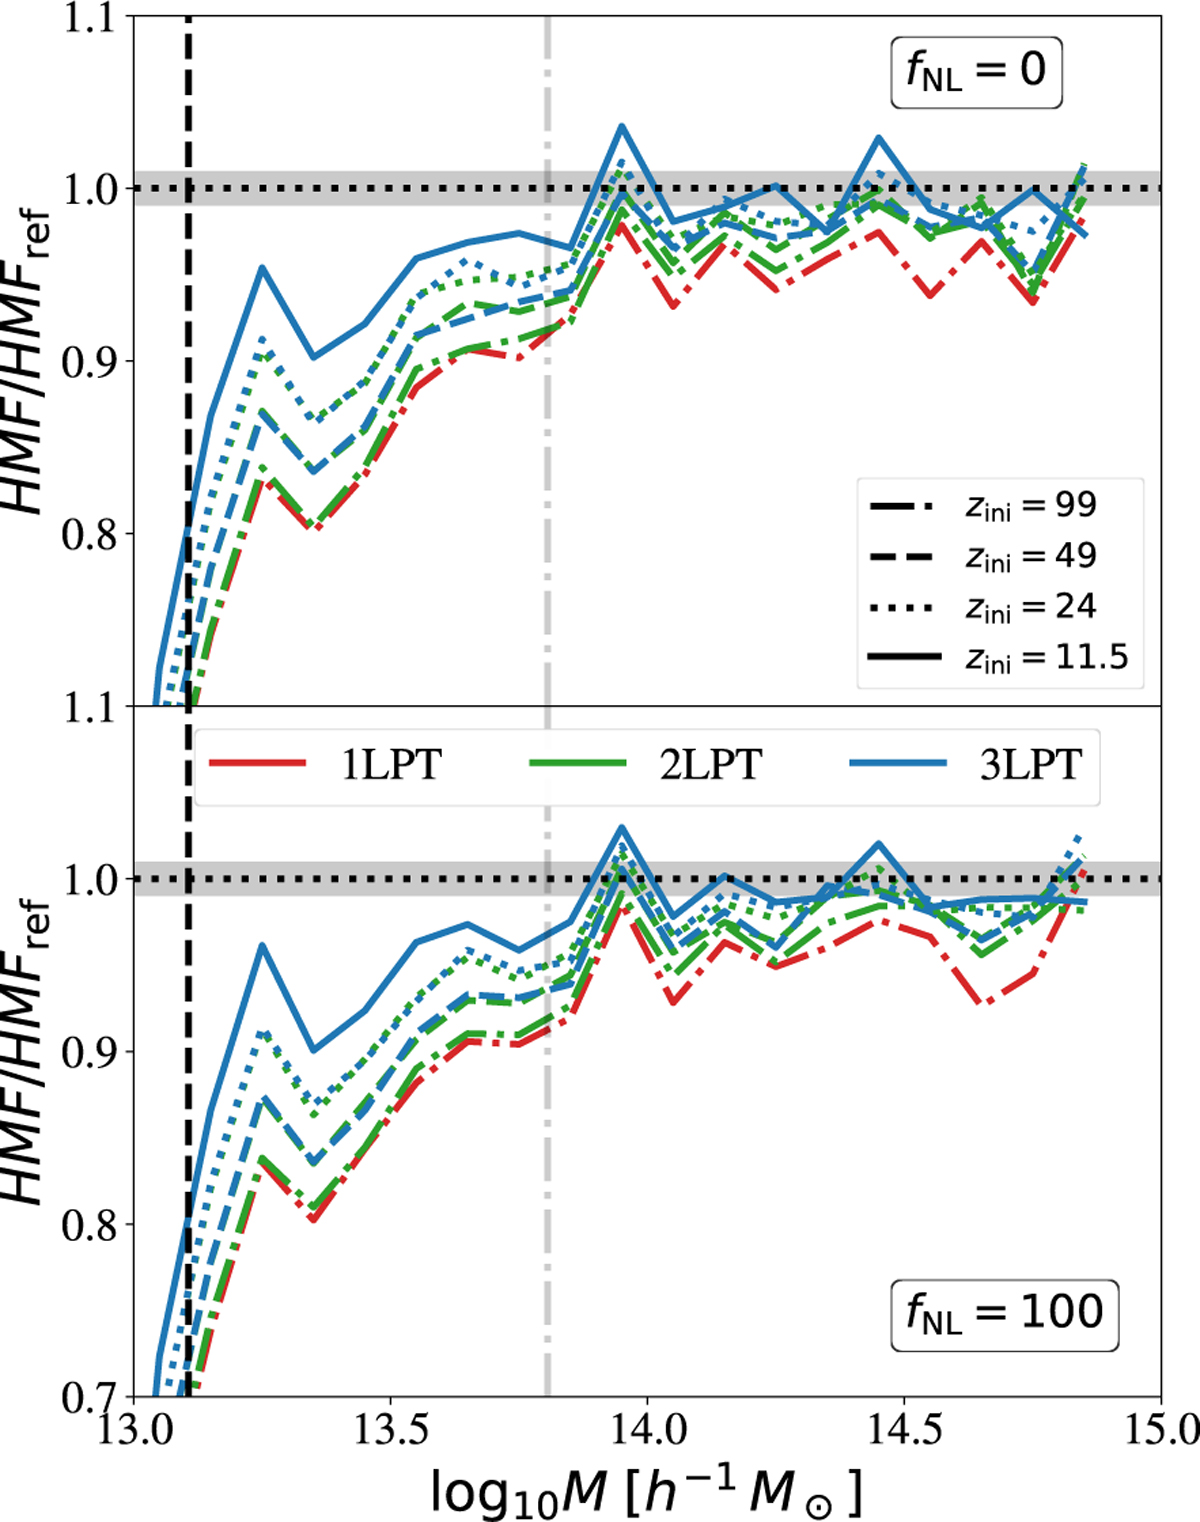
Fig. 2
Download original image
Comparison at z = 0 of the halo mass function for different configurations of the initial conditions (see Section 3) with respect to the higher-resolution reference simulations (see Section 3.3). The upper panel shows the results for the fNL = 0 simulations, while the lower panel shows the case with fNL = 100. The line colour encodes the LPT order used for the initial conditions (red: 1LPT, green: 2LPT, and blue: 3LPT), while the line styles indicate the initial redshift. The dashed vertical lines show the limit of 20 particles per halo; the limit of 100 is indicated by the dash-dotted vertical lines. The shaded regions indicate the 1% difference around the reference simulation. Starting the simulation at lower redshifts improves the convergence towards the high-resolution reference.
Current usage metrics show cumulative count of Article Views (full-text article views including HTML views, PDF and ePub downloads, according to the available data) and Abstracts Views on Vision4Press platform.
Data correspond to usage on the plateform after 2015. The current usage metrics is available 48-96 hours after online publication and is updated daily on week days.
Initial download of the metrics may take a while.