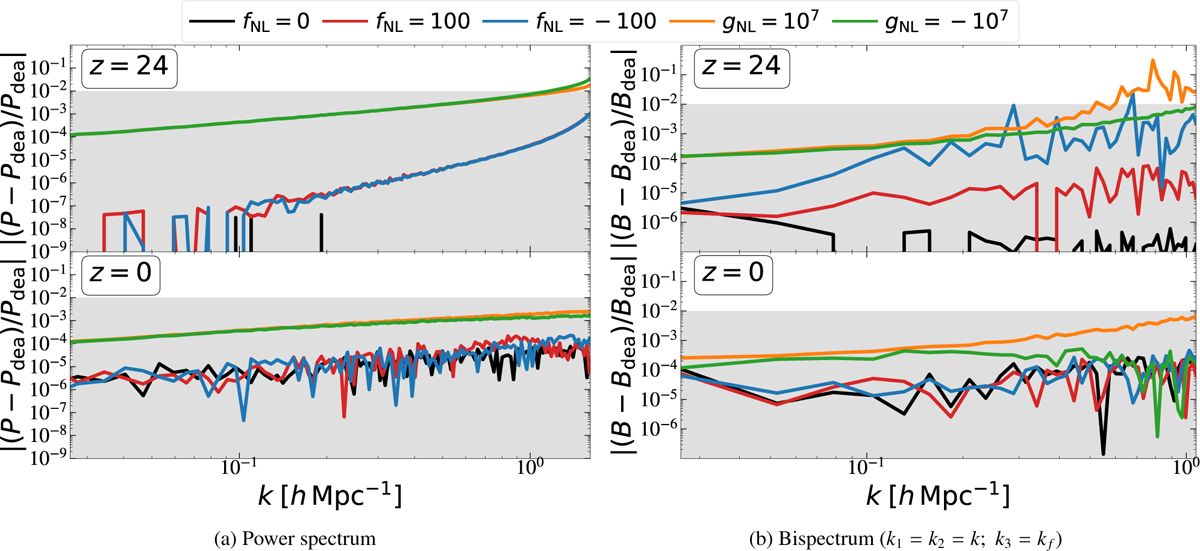
Fig. 3
Download original image
Relative difference of the aliased with respect to the de-aliased (see Section 3.1) matter power spectrum (left panel) and bispectrum in the squeezed limit (k1 = k2 = k; k3 = kf) (right panel). In the upper panels, we show the differences for initial conditions at z = 24, and in the lower panels, the results for the final snapshot at z = 0. The results for simulations with different PNG models are shown in different colours, as indicated in the legend. The shaded areas show the 1% difference around the higher-resolution reference simulation (Section 3.3). Aliasing introduces a spurious signal in the initial conditions (upper panels) for both the power spectrum and bispectrum, reaching 3% and 10% differences, respectively, in the gNL = 107 case. By late times (z = 0), these discrepancies are suppressed to below 1% across all scales and PNG parameter values considered.
Current usage metrics show cumulative count of Article Views (full-text article views including HTML views, PDF and ePub downloads, according to the available data) and Abstracts Views on Vision4Press platform.
Data correspond to usage on the plateform after 2015. The current usage metrics is available 48-96 hours after online publication and is updated daily on week days.
Initial download of the metrics may take a while.