Fig. 4
Download original image
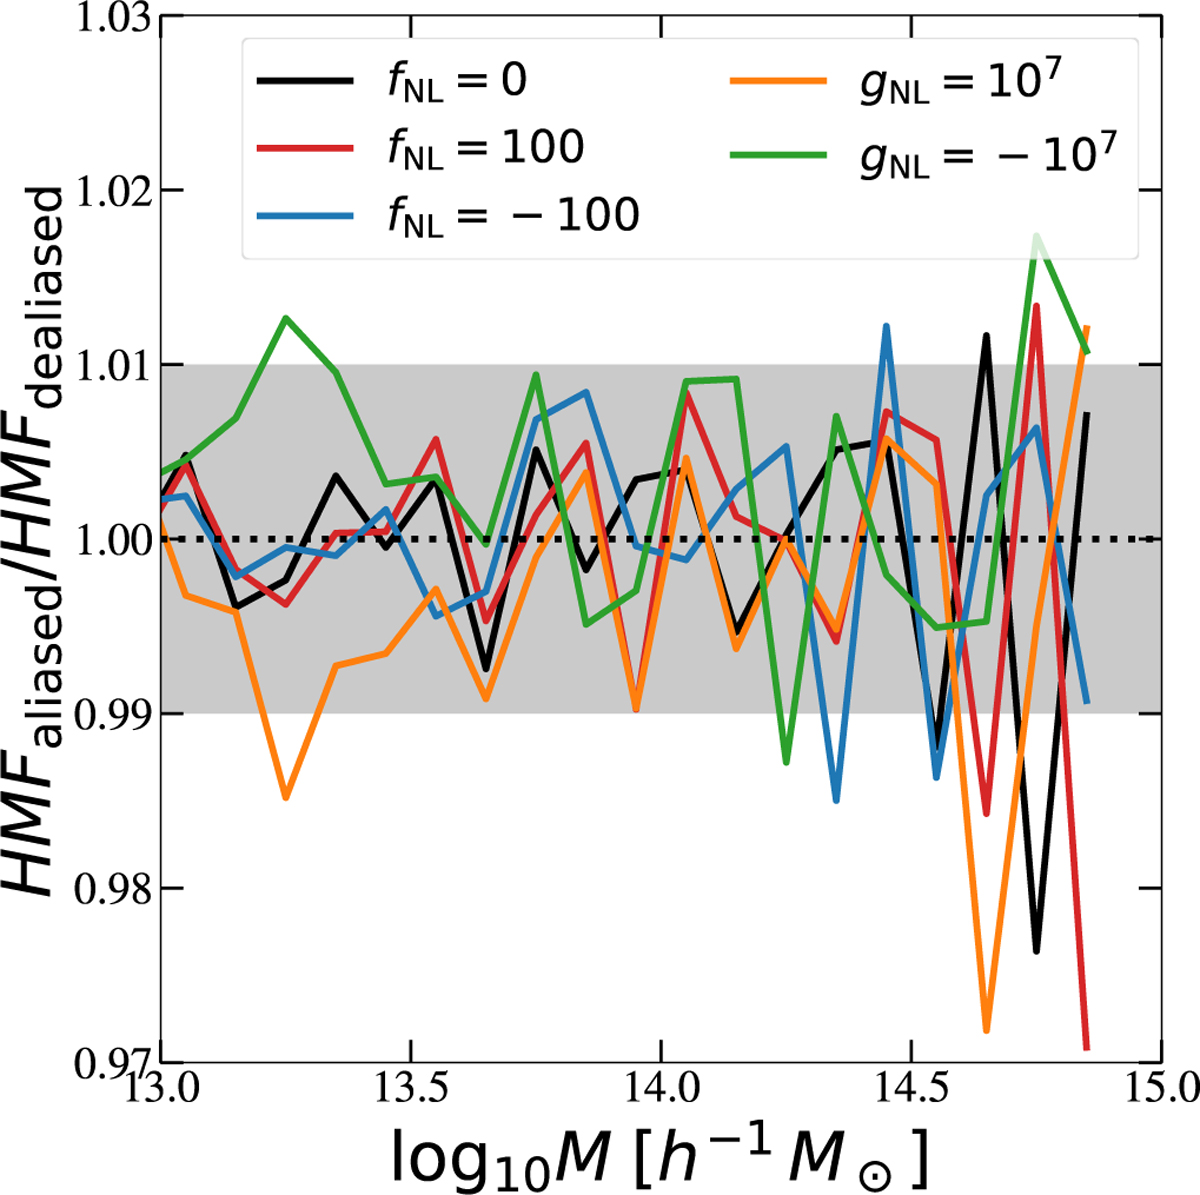
Ratio at z = 0 of the halo mass functions from simulations affected by PNG aliasing to the de-aliased corresponding simulation (see Section 3.1). As indicated in the legend, the line colours correspond to the different PNG models used in the simulations. The shaded area represents the 1% variation around the de-aliased simulations. The PNG aliasing signal produces variations below 3% in the halo mass function at z = 0.
Current usage metrics show cumulative count of Article Views (full-text article views including HTML views, PDF and ePub downloads, according to the available data) and Abstracts Views on Vision4Press platform.
Data correspond to usage on the plateform after 2015. The current usage metrics is available 48-96 hours after online publication and is updated daily on week days.
Initial download of the metrics may take a while.