Fig. 5
Download original image
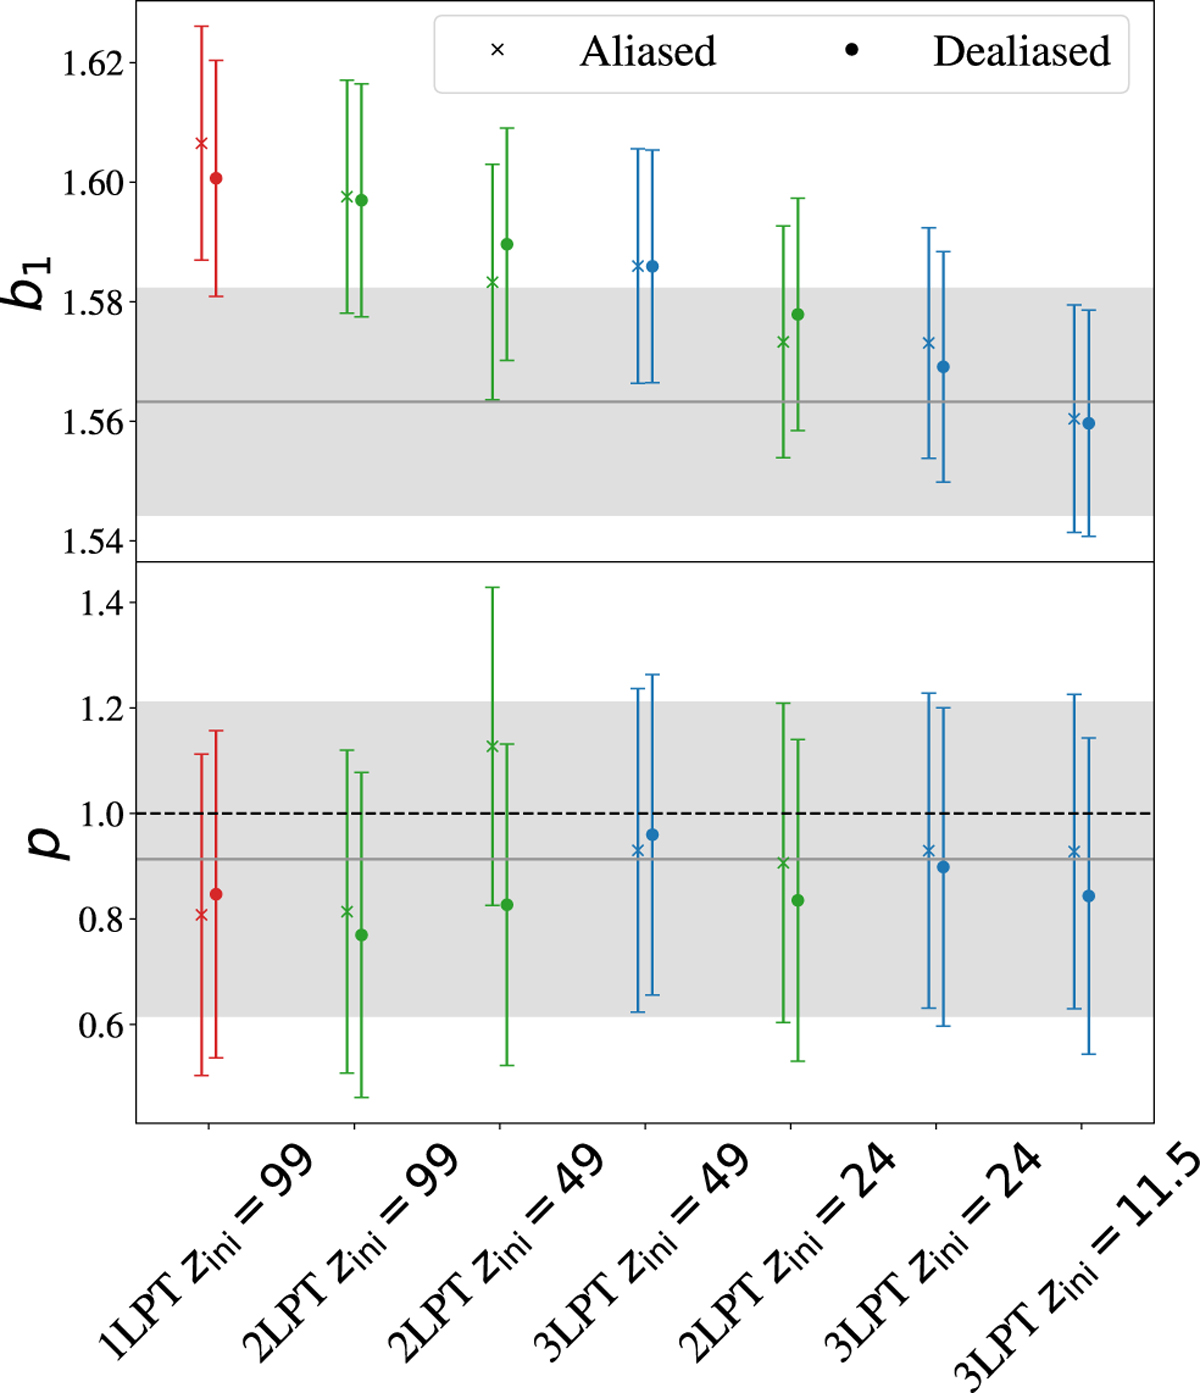
Measurements at z = 0 of the linear bias parameter b1 (upper panel) and the PNG-response parameter p (lower panel) for halos from the simulations summarised in Table 1. The colours indicate the LPT order used for the initial conditions (red: 1LPT, green: 2LPT, and blue: 3LPT). The crosses present the best-fit values with the 1σ error bars from the fits for the simulations with a PNG aliasing signal. The circles present the results after removing the PNG alias signal, or dealiased simulations (see Section 3.1). The horizontal grey lines show the measurements from our reference high resolution simulations (see Section 3.3). The grey regions show the 1σ uncertainty from the fit to the reference simulation (Section 3.3). In the lower panel, the dashed horizontal line shows the universality relation, p = 1.
Current usage metrics show cumulative count of Article Views (full-text article views including HTML views, PDF and ePub downloads, according to the available data) and Abstracts Views on Vision4Press platform.
Data correspond to usage on the plateform after 2015. The current usage metrics is available 48-96 hours after online publication and is updated daily on week days.
Initial download of the metrics may take a while.