Fig. 6
Download original image
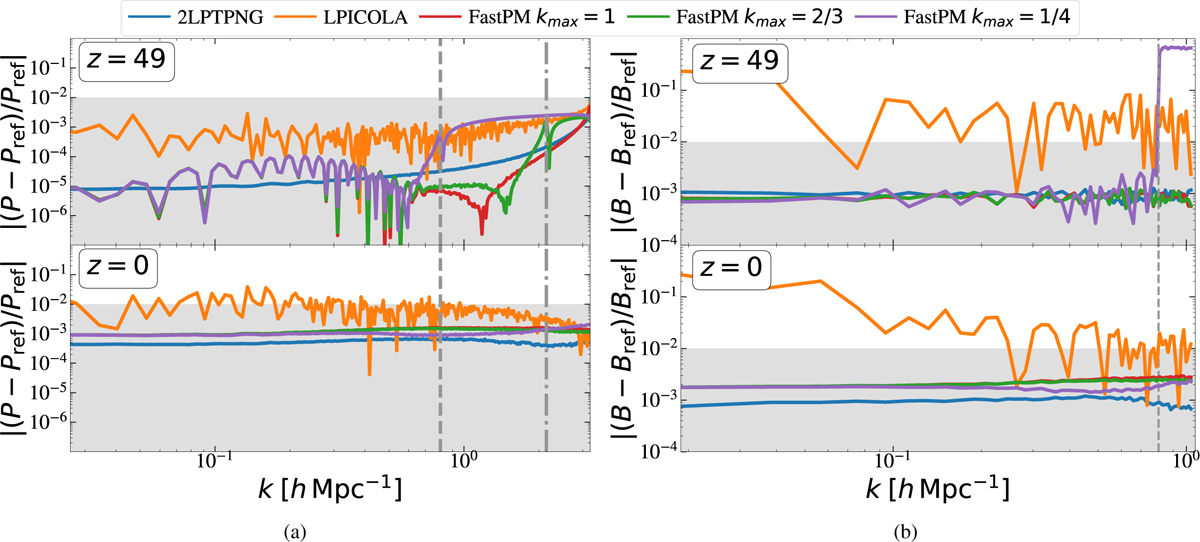
Relative variations of the matter power spectrum (left panel) and bispectrum in the squeezed limit (k1 = k2 = k; k3 = 3kf) (right panel) with respect the reference simulation using MonofonIC (see Section 3.3). In the upper panels, we show the variations at the initial redshift, z = 49, and in the lower panels at z = 0. The codes are shown in different colours: 2LPTPNG (blue), LPICOLA (orange), FASTPM kmax = 1 (red), FastPM kmax = 2/3 (green), and FastPM kmax = 1/4 (purple). The vertical dashed lines show k = knyq × 1/4, and the vertical dash-dotted lines k = knyq × 2/3. The grey shaded regions represent 1% differences with respect to the reference. LPICOLA shows the largest variations at small k, due to a different realisation of the white noise than the reference simulation (see Section 3.2). Notably, FastPM with kmax = 1/4 shows a 80% deviation for ![]() for the bispectrum at the initial conditions (see Section 4.3). 2LPTPNG and FastPM, with kmax = 1 and 2/3, show an excellent agreement with respect MonofonIC, with variations below ~0.1% in the power spectrum and bispectrum at all scales, for both the initial conditions and at z = 0.
for the bispectrum at the initial conditions (see Section 4.3). 2LPTPNG and FastPM, with kmax = 1 and 2/3, show an excellent agreement with respect MonofonIC, with variations below ~0.1% in the power spectrum and bispectrum at all scales, for both the initial conditions and at z = 0.
Current usage metrics show cumulative count of Article Views (full-text article views including HTML views, PDF and ePub downloads, according to the available data) and Abstracts Views on Vision4Press platform.
Data correspond to usage on the plateform after 2015. The current usage metrics is available 48-96 hours after online publication and is updated daily on week days.
Initial download of the metrics may take a while.