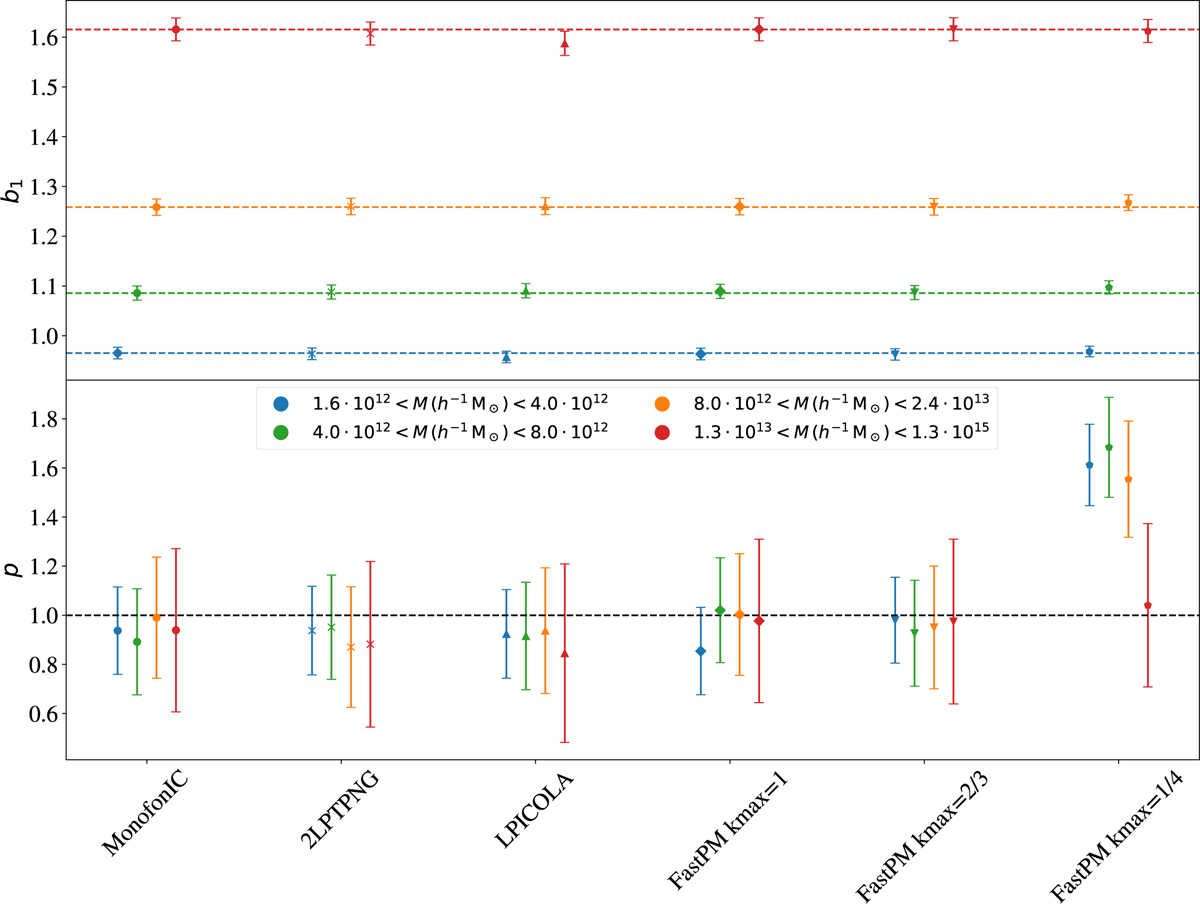
Fig. 7
Download original image
Measurements at z = 0 of the linear bias parameter b1 (upper panel) and the PNG-response parameter p (lower panel) for different codes. All simulations have been initialised at z = 49 using 2LPT and fNL = 100 (see Section 3.2). All the points from the same code or configuration have a different marker and are grouped, from left to right, MonofonIC, 2LPTPNG,LPICOLA, and FastPM, with kmax = 1, kmax = 2/3, and kmax = 1/4. the colours indicate different halo mass bins (blue: 1.6 · 1012 < M(h−1 M⨀) < 4.0 · 1012, green: 4.0 · 1012 < M(h−1M⨀) < 8.0 · 1012, orange: 8.0 · 1012 < M(h−1M⨀) < 2.4 · 1013, and red: 2.4 · 1013 < M(h−1M⨀) < 1.3 · 1015). The horizontal dashed lines in the upper panel show the values of b1 measured in our reference simulation, using MonofonIC (Section 3.3). In the lower panel, the horizontal dashed line shows the universality relation for bϕ/p. The value of p measured from the simulation run with FastPM assuming kmax = 1/4 is ~2.7σ away from the reference for the first three mass bins (Section 4.2). The values of b1 and p measured from all other codes and configurations agree within 1σ.
Current usage metrics show cumulative count of Article Views (full-text article views including HTML views, PDF and ePub downloads, according to the available data) and Abstracts Views on Vision4Press platform.
Data correspond to usage on the plateform after 2015. The current usage metrics is available 48-96 hours after online publication and is updated daily on week days.
Initial download of the metrics may take a while.