Fig. 2
Download original image
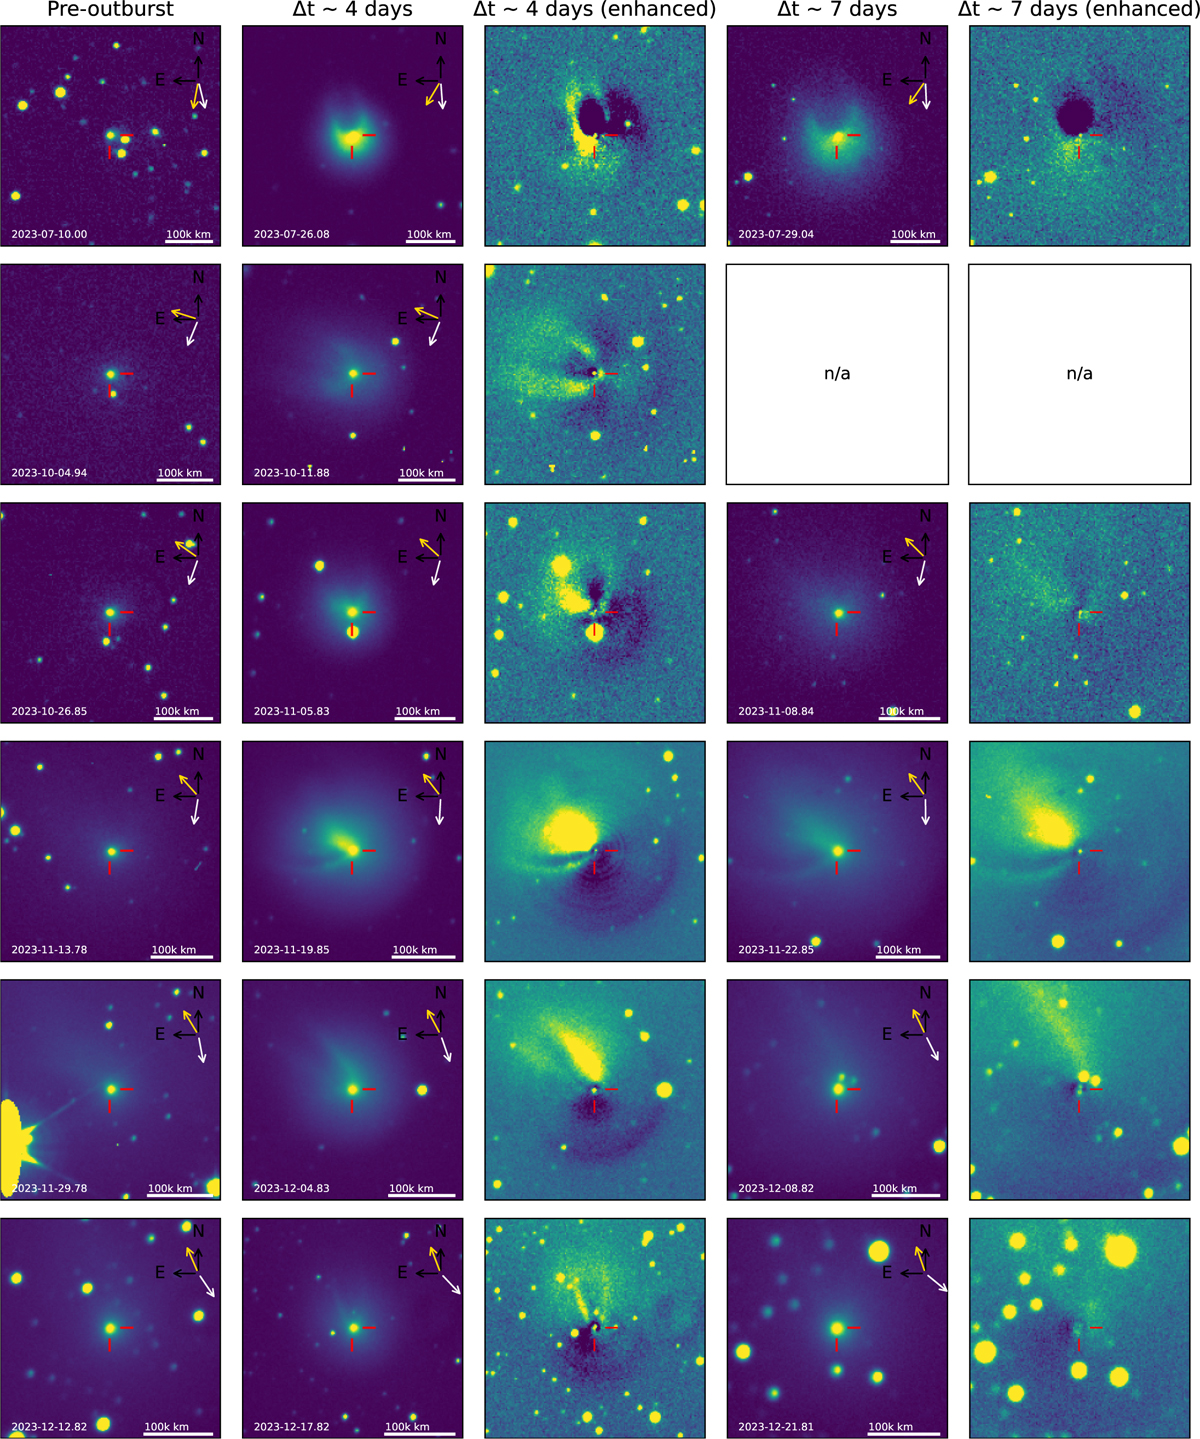
Comet 12P images in the Rc filter during different outbursts. Each row shows a different outburst. Columns, from left to right, correspond to pre-outburst image, coma around 4 days after outburst, same image after subtraction by an azimuthal median profile, coma around 7 days after outburst, and same image after subtraction by an azimuthal median profile. The yellow and the white arrows are the anti-sunward and the negative of the target heliocentric velocity vector directions, respectively. The red cross indicates the photocentre. Images are oriented with north being up and east to the left.
Current usage metrics show cumulative count of Article Views (full-text article views including HTML views, PDF and ePub downloads, according to the available data) and Abstracts Views on Vision4Press platform.
Data correspond to usage on the plateform after 2015. The current usage metrics is available 48-96 hours after online publication and is updated daily on week days.
Initial download of the metrics may take a while.