| Issue |
A&A
Volume 705, January 2026
|
|
|---|---|---|
| Article Number | A89 | |
| Number of page(s) | 10 | |
| Section | Planets, planetary systems, and small bodies | |
| DOI | https://doi.org/10.1051/0004-6361/202556202 | |
| Published online | 09 January 2026 | |
Photometric and spectroscopic monitoring of the outbursting Halley-type comet 12P/Pons-Brooks
1
Space sciences, Technologies & Astrophysics Research (STAR) Institute, University of Liège,
Liège,
Belgium
2
Aix Marseille Univ, CNRS, CNES, LAM,
Marseille,
France
3
Cadi Ayyad University (UCA), Oukaimeden Observatory (OUCA), Faculté des Sciences Semlalia (FSSM), High Energy Physics, Astrophysics and Geoscience Laboratory (LPHEAG),
Marrakech,
Morocco
4
Physical Research Laboratory, Navarangpura, Ahmedabad,
380058
Gujarat,
India
5
Department of Applied Physics and Astronomy, and Sharjah Academy for Astronomy, Space Sciences and Technology, University of Sharjah,
PO Box
27272
Sharjah,
United Arab Emirates
★ Corresponding author: This email address is being protected from spambots. You need JavaScript enabled to view it.
Received:
1
July
2025
Accepted:
10
November
2025
Abstract
Context. Comet 12P/Pons-Brooks is a Halley-type comet known for its outbursting activity during its previous perihelia in 1883 and 1953. Its strong activity and favourable observing geometry gave a great opportunity to study this outburst-prone comet during its 2024 return with modern instruments.
Aims. We aim to study the activity and composition of 12P/Pons-Brooks during its 2024 passage through long-slit spectroscopy and narrow- and broad-band photometry and imaging.
Methods. The photometric survey contains over 130 nights of observation with TRAPPIST-North and -South from May 6, 2023 (rh = 4.62 au, inbound), to September 7, 2024 (rh = 2.06 au, outbound). We collected images with broad-band Johnson–Cousins filters (BVRcIc) and narrow-band HB filters (OH, CN, C2, C3, NH, and dust continuum). We obtained long-slit low-resolution spectra at the Observatoire de Haute Provence with the MISTRAL instrument on the night of March 23, 2024, at a heliocentric distance of 0.94 au. The spectra were used to analyse the emissions from the different molecular bands.
Results. We detect nine strong outbursts, which show an approximate two-week periodicity; the OH production rate reaches values exceeds 1029 molecules/s and the A(0)fρ dust activity proxy above 105 cm. Dust images show the formation of a double horn-shaped coma and the expansion of a dust shell in the days following the strongest outbursts. The gas-to-dust ratio behaviour during these events differs from other observations of outbursting comets closer to the Sun, while outbursts rather share similarities with the centaur comet 29P/Schwassmann-Wachmann. The analysis of CN jets between 1.02 and 2.13 au suggests a nucleus rotation period of either 29.45 h or 58.90 h and a gas ejection velocity of 1.03 ± 0.09 km/s. From the MISTRAL spectra, emission bands from C2, NH2, and CN were observed, as well as H2O+ in the anti-sunward direction.
Key words: techniques: photometric / techniques: spectroscopic / comets: general / comets: individual: 12P/Pons-Brooks
© The Authors 2026
 Open Access article, published by EDP Sciences, under the terms of the Creative Commons Attribution License (https://creativecommons.org/licenses/by/4.0), which permits unrestricted use, distribution, and reproduction in any medium, provided the original work is properly cited.
This article is published in open access under the Subscribe to Open model. This email address is being protected from spambots. You need JavaScript enabled to view it. to support open access publication.
1 Introduction
Comet 12P/Pons-Brooks (hereafter 12P) is a Halley-type comet with an orbital period of 71 years and an upper estimate of the nucleus size of 17 ± 6 km (Ye et al. 2020). While the dynamical origin of Halley-type comets remains under debate, the most likely source is the Oort Cloud (Wang & Brasser 2014). Comet 12P was first discovered by J.L. Pons in 1812 and rediscovered during its following passage by W.R. Brooks in 1883 (Kronk 1999). It has been identified as historical comets C/1385 U1 and C/1457 A1, and a possible earlier comet in 245, which makes it one of the oldest periodic comets found in historical reports (Meyer et al. 2020). The comet is the parent body of different meteor showers (Tomko & Neslušan 2016).
In its past passages, 12P showed deviation from quiescent cometary activity, displaying sudden increases of brightness known as outbursts (Hughes 1975). During the 1883 return, large outbursts were reported inbound at a heliocentric distance (rh) of 2.16 au with Δmag = 5 and at rh = 0.90 au with Δmag = 1–3 (Whitney 1955). During the 1954 passage, large outbursts were reported inbound at rh = 4.43 au with Δmag = 5, at rh = 3.6 au with Δmag = 3, and at rh = 2.7 au with Δmag = 4.5 along with an appreciable increase in the coma size (Kronk 2009).
Many observation campaigns aimed to study 12P activity during this return (perihelion at 0.78 au on April 21, 2024), especially after it gained attention following a first strong Δmag = 5 outburst, detected by Elek Tamás on July 20, 2023 (rh = 3.88 au), resulting in the formation of a distinctive double horn-shaped coma. Uncommon recurring outbursts followed, whose mechanisms are still not well understood. Amateur astronomers were especially active in detecting and constraining the onset time of outbursts (see, for example, the Comet Chaser project1 and the BAA forum2).
Several mechanisms have been proposed to explain cometary outbursts: crystallisation of amorphous water ice (Li et al. 2011; Noonan et al. 2021; Jewitt & Luu 2025), cliff collapse or deepening fracture and the subsequent exposure of fresh ices (Pajola et al. 2017; Noonan et al. 2021), nucleus splitting (Jewitt et al. 2020), and explosive gas release from subsurface reservoirs (Miles 2016; Müller et al. 2024, 2025). The processes involved remain incompletely understood and may coexist within a single comet. For instance, different types of outbursts have been proposed for Jupiter-family comet 67P/Churyumov–Gerasimenko (hereafter 67P) based on the Rosetta mission observations (see references above). Furthermore, in centaur comet 29P/Schwassmann–Wachmann (hereafter 29P), CO has been found to be a driver of some but not all outbursts (Bockelée-Morvan et al. 2022; Wierzchos & Womack 2020). Periodic outbursts have mainly been characterised in 29P (Miles 2016) and, more recently, in 12P (Jewitt & Luu 2025).
In this paper, we present an intensive photometric and spectroscopic study of 12P during its 2024 return, aiming at a better understanding of its composition and activity. We characterise the coma morphology and chemistry during quiescent and outbursting periods, showing the peculiarities of the 12P outbursting behaviour. In Section 2, we describe the observations and data reduction methods. The light curve and the detected outbursts are presented in Section 3.1, followed by the analysis of the coma features during the outbursts in Section 3.2. Section 3.3 deals with gas and dust activities and the chemical composition of the coma with respect to the heliocentric distance and the outbursting activity. In Section 3.4, we discuss the morphology of the coma during quiescent activity through contrast-enhanced CN narrow-band images, and we explain how we derived physical properties of the nucleus and the coma. Discussions and conclusions are presented in Sections 4 and 5, respectively.
2 Observations and methods
2.1 TRAPPIST imaging
Images were obtained on a regular basis, weekly during quiescent activity to daily during outbursting activity, from May 2023 to September 2024. Observations were carried out with TRAPPIST-North (TN; Oukaimeden Observatory, Morocco, Z53) during the inbound leg of the orbit at rh ranging from 4.62 to 1.02 au (May 07, 2023, to March 16, 2024), and TRAPPIST-South (TS; La Silla Observatory, Chile, I40; Jehin et al. (2011)) during the outbound leg of the orbit at rh ranging from 1.59 to 2.60 au (April 09, 2024, to September 23, 2024). The 0.60-m robotic telescopes are equipped with broad-band B, V, Rc, and Ic Johnson-Cousins filters as well as HB narrow-band cometary filters (Farnham et al. 2000). The HB narrow-band filters isolate the main emission bands of OH (centre wavelength at 309.7 nm), CN (336.1 nm), NH (336.1 nm), C3 (406.3 nm), and C2 (513.5 nm) as well as gas-free dust continuum in the blue (BC; 445.3 nm), green (GC; 525.9 nm), and red (RC; 713.3 nm). TS is equipped with a 2K × 2K FLI Proline CCD with a pixel scale of 0.64″/pixel, resulting in a field of view of 22′ × 22′, while TN is equipped with a 2K × 2K Andor IKONL BEX2 DD with a pixel scale of 0.59″/pixel, resulting in a field of view of 20′ × 20′. The comet was too close to the Sun from April to June 2024, preventing us from taking measurements during that period. Further observations after that period (the full post-perihelion dataset) only comprise Rc band images due to a technical issue with the TS filter wheel. The narrow-band observations include all nights from the pre-perihelion survey, from the first detected major outburst at 3.88 au.
The data reduction procedure is made up of python scripts making use of well-known packages such as astropy (Astropy Collaboration 2022) and photutils (Bradley et al. 2024) for fits images manipulation and flux extraction, differing from previous TRAPPIST papers where the reduction was based on IRAF libraries (e.g. in Opitom et al. (2015) and Moulane et al. (2018)). However, the underlying calculations are similar, and no significant differences have been found in the results between the python and IRAF pipelines. For the image calibration, we followed standard procedures with regularly taken bias, flat, and dark frames. For the absolute photometry, we measured regularly the zero points of our system with reference stars as described in Farnham et al. (2000). The wide fields of TN and TS allow us to sample the sky background in a region devoid of comet flux to subtract it from the images. Uncertainties on the fluxes, propagated to the other measured quantities, are the quadratic combination of 3 sigma of the sky background and 5% on the extinction coefficient, the latter being the most important at high airmass but negligible at low airmass. Upon multiple measurements in the same filters taken during the same night and no significant changes during the night, the reported value in the manuscript is an average weighted by the individual uncertainties.
We derived the dust activity proxy A(θ)fρ (A’Hearn et al. 1984) for the broad-band filters using a circular aperture of 10000 km centred on the photocentre of the comet. We corrected A(θ)fρ for the phase angle dependency with the 0° normalised composite dust phase function from D. Schleicher3, built from the phase functions of Schleicher et al. (1998) and Marcus (2007), to obtain A(0)fρ. This phase function has the advantage of covering both low and high phase angles simultaneously. All ephemeris and phase angles were obtained from the NASA JPL Horizons system4.
To compute the gas production rates (Q) from the narrowband gas images, we extracted the flux within an annulus aperture between nucleocentric distances of 103.6 and 104.1 km. The choice of an annulus was made to decrease aperture effect and lessen dust contamination. The dust contribution is less extended than the gas and peaking on the nucleus. The dust contribution was subtracted using the flux, within a similar aperture, from a BC dust filter image taken during the same night. It was scaled to the right bandpass by approximating the colour of the dust to be identical to that of the Sun. The fraction of the molecular emission band falling outside of the filter bandpass was accounted for by correcting the flux by the gamma factor given by Farnham et al. (2000). Finally, the flux was converted to column density using fluorescence efficiencies from the literature (Schleicher & A’Hearn 1988; Kim et al. 1989; Schleicher 2010; A’Hearn et al. 1995). The Haser model (Haser 1957) implemented in the sbpy package (Mommert et al. 2019) was used to obtain Q by adjusting the model column density to the observations. We used the same scale-lengths (see Table 1) and ejection velocity (1 km/s, independent of rh) as used in A’Hearn et al. (1995) and previous TRAPPIST studies for consistency.
2.2 MISTRAL spectroscopy
Comet 12P was observed on 23 March 2024 using the MISTRAL spectrograph camera (Schmitt et al. 2024) on the 1.93 m at the Observatoire de Haute-Provence (OHP) in long-slit spectroscopic mode. The observations were conducted in manual tracking mode with an exposure time of 120 seconds, when the comet was at rh = 0.93 au and a geocentric distance of 1.62 au. Data were acquired in the blue mode, covering the 4200–8000 Å range at a resolution of ~750, with a slit width of 1.9″. To correct for sky background, a separate sky frame with a similar exposure time was captured. The comet and standard star frames underwent bias subtraction and flat fielding using a tungsten spectral flat lamp. Cosmic rays were removed with the LACOSMIC package (Dokkum 2001).
From the observed spectrum, production rates for the C2 and NH2 emission bands were calculated by extracting spectra with equal-width apertures away from the photocentre to derive the spatial column density profile. These calculations used Haser modelling (Haser 1957) as described in Aravind et al. (2022). The spectrophotometric standard star G191B2B, observed under identical conditions, was used to produce the instrument’s sensitivity curve and to flux calibrate the comet spectra. Because the same narrow slit is used for both the comet and standard star observations, variations in seeing conditions can lead to flux losses in the standard star, potentially causing an overestimation of the comet’s flux during flux calibration. To mitigate this effect, a slit correction factor is applied based on the Point Spread Function (PSF) along the slit length, following the method described in Lee & Park (2006). Additionally, the solar analogue star HD 49158 was observed to remove the dust-reflected solar continuum from the optical spectra.
The A(0)fρ phase function correction and Haser model parameters for C2 were the same as for the TRAPPIST data. Fluorescence efficiencies and Haser model scale lengths (see Table 1) for NH2 were the same as in Fink (2009).
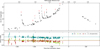 |
Fig. 1 Magnitude and colour evolution of 12P. Top: light curve of comet 12P with TRAPPIST in the Rc band with an aperture radius of 5″. Upper arrows indicate saturated images that could only yield an upper limit on the magnitude. The detected outbursts are indicated with red tick marks. The vertical dashed line indicates perihelion. Bottom: colour indices from the BVRcIc filters. Reference colour indices for long-period comets (LPC) from Jewitt (2015) are indicated as horizontal dashed lines. No colour indices are available for the post-perihelion survey. The vertical dashed line indicates perihelion. |
Scale lengths of parent (Lp) and daughter (Ld) species used in this work.
3 Results and analysis
3.1 Light curve and colours
The light curve in the Rc band from the whole survey, as well as colour indices for the pre-perihelion survey, are presented in Figure 1 and tabulated in Table A.1. Nine major outbursts (Δmag > 0.5) were detected pre-perihelion at rh ranging from 3.88 au on July 21, 2023, to 1.21 au on February 29, 2024, with amplitudes up to 4 units of magnitude (see Table 2). The outbursting activity displays a periodicity of about two weeks between the September 25 and December 14 events. The timing of other observed outbursts remains broadly consistent with this periodicity, although some expected events appear to be missing. The latest outbursts on February 3 and 29, 2024, have a lesser amplitude and are more difficult to distinguish from the exponential quiescent activity increase closer to the perihelion, but are confirmed by changes in coma features (see Section 3.2).
Only the Rc band is shown in Figure 1 for clarity, as the light curves in the different B, V, and Ic filters are similar in trend. Indeed, no strong trend in the colour indices with rh is observed, except for the V-R decrease from rh < 2.2 attributed to gas contamination of the broad-band filters (predominantly fluorescence of C2, C3, CN, and possibly NH2) and not reflecting changes in dust properties. The average colour indices for B-V = 0.71 ± 0.03, V-R = 0.41 ± 0.02 (above 2.5 au), and R-I = 0.38 ± 0.03, are in agreement with colour indices of comets of different dynamical types given by other surveys (Betzler et al. 2017; Jewitt 2015).
Comet 12P major outbursts observed with TRAPPIST.
3.2 Outbursts morphology
Coma features were observed following the outbursts in the dust filters with the help of azimuthal median subtraction and Larson-Sekanina (rotational) filters (Larson & Sekanina 1984). Figure 2 compares images of the coma in the pre-outburst states and 4 days and 7 days after the outbursts. Two distinguishable features in the coma are observed in the days following outbursts. The first is a quasi-circular expanding shell, and the second a double horn-shaped feature expanding from the nucleocentre. The projection on the sky of the shell remained approximately circular during its expansion, with a slight elongation in the anti-sunward direction due to the solar radiation pressure. Measuring directly the external limit of the shell at the noise level can be hazardous, as changing signal-to-noise ratio (S/N) in different images can result in measuring different noise limits rather than the edge of the shell itself. We attempted to use the method by Hsieh et al. (2010), consisting of measuring the shift of different structures in a log-log radial profile of the coma, to avoid a false detection of the shell boundary caused by a limited S/N. However, in our dataset, it was difficult to find features in the coma, resulting in large uncertainties in the velocity measurements. Apparent shell velocities (vshell) in the anti-sunward direction are presented in Table 2. We found that vshell approximately doubled from 128 ± 64 m/s during the July 21 outburst to 251 ± 38 m/s during the December 14 outburst, scaling nearly linearly with the heliocentric distance as ![Mathematical equation: $\[r_{h}^{-1.2 \pm 0.2}\]$](/articles/aa/full_html/2026/01/aa56202-25/aa56202-25-eq3.png) .
.
In addition to the circular dust shell, the double horn-shaped coma was observed after each of the strong outbursts, but with varying intensity and angular extent of the individual horn-like features (see Figure 2). A general enhancement in brightness in the anti-sunward direction is observed, with the individual horn-like features becoming narrower and more elongated when rh gets smaller. With the exception of the July 21 event, where no clear orientation of the feature is evident, the feature consistently appears directed towards the anti-sunward side during the subsequent outbursts. It should be noted, however, that variations in the comet’s projected orientation due to changes in phase angle may influence the apparent morphology of the feature.
3.3 Production rates and abundance ratios
3.3.1 TRAPPIST
The production rates (Q) and the dust activity proxy A(0)fρ are tabulated in Table A.2 and plotted in Figure 3. Minor gases CN, C2, and C3 were detected from 3.88 au when measured for the first time following the July 21 outburst, while OH was detected for the first time before the November 10 big outburst, at 2.66 au. Outbursts detected in the light curve are also well detected in both the Q and A(0)fρ curves, with an activity increase up to one order of magnitude for the gas and up to two orders of magnitude for the dust. The highest measured increase was during the November 10 outburst, OH production rates reaching above 1029 molecules/s and A(0)fρ reaching above 105 cm−1. Production rates are well in agreement with the long-slit spectroscopic observations by Ferellec et al. (2024) and OH radio observations by Li et al. (2025).
The higher dust production rate during outbursts is very well seen in the gas-to-dust ratio in Figure 4. However, no change in the gas abundance ratios was observed during outbursts. The strong dispersion of the C2/CN and C3/CN ratios above 2.5 au (see Figure 4) is not to be interpreted as day-to-day variations in the coma’s composition, but rather as the inadequacy of the Haser model in representing the complexity of the coma’s physical and chemical processes. Fitting of the Haser model to the coma column density was challenging, especially for the C2 radical. Complex chemistry, extended sources, and the physical conditions during outbursting activity are all causes that could reduce the Haser model’s relevance. The same difficulty was reported in the 12P spectroscopic study by Ferellec et al. (2024). They further highlighted the difficulty in deriving accurate C2 production rates by fitting Haser scale lengths to the observed profiles and using a modified Haser model for outbursting events, hinting at extended sources or complex chemistry as the origin of C2.
Medians of the abundance ratios with respect to CN are given in Table 3. Comet 12P is typical according to the classification by A’Hearn et al. (1995) based on the C2/CN ratio. Other abundance ratios are also in line with the typical distribution of comets.
3.3.2 MISTRAL
The reduced and extracted 1D spectrum from MISTRAL at OHP on March 23, 2024, is presented in Figure 5. Several typical cometary emission bands from C2 and NH2 radicals were identified. The production rates were determined as (1.91 ± 0.02) · 1027 molecules/s for C2, consistent with values from TRAPPIST (see Figure 3), and (4.91 ± 0.09) · 1026 molecules/s for NH2. Consistency between the photometric and the spectroscopic measurements is important to confirm that the dust contamination removal from the gas narrow-band filters worked properly. The dust production proxy A(0)fρ, measured over the bandpass of the HB continuum narrowband filters GC and RC, was 15622 ± 840 cm and 19481 ± 850 cm, respectively, again aligning with TRAPPIST observations at nearby epochs.
The long-slit observations were also used to investigate ionic emissions in the coma. Spectra were extracted in both the tailward (anti-sunward) and anti-tailward (sunward) directions from the photocentre. As shown in Figure 5, the spectra are similar, except for specific regions marked with arrows. The absence of these emissions in the anti-tailward direction confirms their cometary origin. Further analysis, cross-referencing with laboratory spectra of H2O+ (Lew 1976), identified these emissions as corresponding to the (8-0) and (6-0) bands of H2O+ emission. No CO+ lines were detected; unfortunately, MISTRAL does not cover the bluest part of the visible spectrum where the strongest CO+ bands and the main CN band are located.
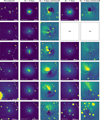 |
Fig. 2 Comet 12P images in the Rc filter during different outbursts. Each row shows a different outburst. Columns, from left to right, correspond to pre-outburst image, coma around 4 days after outburst, same image after subtraction by an azimuthal median profile, coma around 7 days after outburst, and same image after subtraction by an azimuthal median profile. The yellow and the white arrows are the anti-sunward and the negative of the target heliocentric velocity vector directions, respectively. The red cross indicates the photocentre. Images are oriented with north being up and east to the left. |
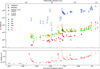 |
Fig. 3 Gas and dust activity evolution of 12P. Top: production rates obtained from TRAPPIST and MISTRAL, and by Ferellec et al. (2024) and Li et al. (2025). Downward arrows represent upper limits, where the threshold is determined by the measurement uncertainty (see Section 2). Bottom: A(θ)fρ with the Rc filter measured in a 10000 km aperture. Upward arrows indicate a lower limit due to saturated images. Both are logarithmic scales to better show the outbursts. |
Medians of the logarithms of the 12P abundance ratios compared to the taxonomic groups found by A’Hearn et al. (1995).
3.4 CN coma morphology and nucleus rotation
We used an azimuthal median subtraction filter to analyse jet features in the coma from the CN images. Although asymmetries in the coma and possible small jets could be observed in individual images as early as October 11, 2023, at rh = 3.0 au, more regular and pronounced features that can be tracked over successive nights were only observed from December 21, 2023, after most of the intense outbursting activity. The following analysis thus made use of around 4 months of CN imaging from mid-December 2023 to mid-March 2024, spanning over 42 distinct observation nights (from 2.13 to 1.02 au).
On all of the selected nights, two CN jets were detected at an angle of 180° after the filtering, forming an image with a two-fold symmetry (see Figure 6). This feature was constant over the whole period the jets were detected. No significant change in the orientation of the jets was observed from night to night, indicating that the nucleus rotation period is close to an alias of 24 h. We did a Lomb-Scargle (LS) frequency analysis using the astropy package over the jets’ angles to find the nucleus rotation period. As the jets are indistinguishable from one another across the different nights, and given the two-fold symmetry, we used the angle between the northernmost jet, the nucleus, and celestial north in each image as a function of time for the LS analysis. However, we note that the true rotation period could be twice the value obtained due to this symmetry.
To account for uncertainty in the measurement of the jet angle, the analysis was repeated over 100 000 iterations with random variations of the measured angles between −π/32 and +π/32. Of all the iterations, 97% yielded a maximum power above a false positive of 0.01, out of which all had the same best frequency of 0.815 day−1. This corresponds to a period of 29.45 h, or 58.90 h, considering the previous simplification of the two-fold symmetry for the measurement of the jets’ angles. The solution of 58.90 h is in agreement with the 57 ± 1 h found by Knight et al. (2024) from the CN features between January 31 and February 16, 2024.
By assuming a constant gas velocity, the projected gas velocity could be estimated by fitting an archimedian spiral to the jets. We found a mean CN outflow velocity of 1.03 ± 0.09 km/s, assuming a rotation period of 58.90 h, or twice that if we assumed the alternative period of 29.45 h; the uncertainty represents the standard deviation of the mean. We measure no significant trend in the expansion velocity during that period.
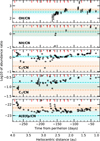 |
Fig. 4 Gas and dust abundance ratios. The outbursts are indicated with red tick marks. The ranges for typical and depleted comets as defined by A’Hearn et al. (1995) are indicated in blue and orange, respectively. C3/CN reference from A’Hearn et al. (1995) has been shifted by 0.32 to compensate for different continuum removal factors between the studies (see Notes Table 3). Afρ/CN references from A’Hearn et al. (1995) are not corrected for the phase angle, while the Afρ phase correction factor applied to 12P in this study ranges between 0.64 and 0.38. |
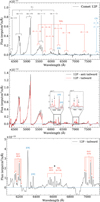 |
Fig. 5 Comet 12P MISTRAL spectra. Top: main emission bands visible in the spectrum extracted at the photocentre. Middle: comparison between tailward and anti-tailward spectra, highlighting the H2O+ detection. Bottom: zoom on H2O+ features. |
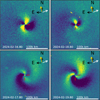 |
Fig. 6 Comet 12P in the CN filter (300s exposure time) after subtraction of an azimuthal median profile on selected dates. The yellow and white arrows are the anti-sunward and the negative of the target heliocentric velocity vector directions, respectively. The red cross indicates the photocentre. Images are oriented with north being up and east to the left. |
4 Discussion
During its 2024 passage, 12P/Pons-Brooks displayed strong, quasi-periodic outbursts with a timescale of approximately two weeks. The first observed event took place at a heliocentric distance of 3.88 au, outside of the water snow line at ~3 au (Crovisier & Encrenaz 2000), and all of them were observed in pre-perihelion. In contrast, our survey did not reveal any major post-perihelion outbursts, nor are we aware of such events being reported by other observers. This asymmetry suggests a possible seasonal effect, whereby specific outburst-prone regions on the nucleus may become illuminated during the inbound leg of the orbit but remain in shadow after perihelion. The same behaviour can be observed from historical records on previous apparitions (Kronk 1999, 2009), with 12P mainly outbursting during the inbound leg of the orbit. However, the fact that most observers were located in the Northern Hemisphere at the time may have introduced an observational bias. Additionally, the limited availability of observational data post-perihelion in our survey may contribute to the apparent absence of detected outbursts. Another possibility is that the outbursts are driven by super-volatile ices that become depleted by the time the comet reaches perihelion. However, this seems unlikely unless a mechanism exists to replenish surface volatiles, as the observed behaviour is consistent across multiple apparitions.
Most observed outbursts in comets are unique events, both when occurring below 3 au (see Tao et al. 2000; Lin et al. 2009; Kelley et al. 2022b; Jehin et al. 2022; Opitom et al. 2016) and in the outer solar system (see Hui et al. 2019; Kelley et al. 2022a). Periodic outbursts are less common but have already been observed on 29P (Miles et al. 2016), a centaur with a high CO/CO2 ratio (Ootsubo et al. 2012). Miles (2016) proposed a mechanism based on the formation of pockets of dissolved gas under high pressure below the crust, leading to the rupture of the crust and eventually the explosive release of gas and dust. Resealing of the fissure by gravitational collapse allows for the process to repeat cyclically. In a recent paper, Jewitt & Luu (2025) looked at the energy and mass release associated with 12P’s outbursts. Their calculations show that the kinetic energy of the outbursts is comparable to the energy released by the crystallisation of amorphous water ice, while the amount of mass ejected rules out land features collapsing mechanisms induced by water activity, such as proposed for 67P (Müller et al. 2025). The interval between the outbursts could reflect the timescale for the system to absorb enough solar energy and trigger the next event. Zhao et al. (2025) also favour the crystallisation of amorphous water ice as a mechanisms based on the energy released during the November 1 outburst. Both proposed mechanisms for periodic outbursts are consistent with possible onsets outside of the water-dominated activity regime and could operate in 12P.
Using narrow-band filters, CN, C2, and C3 were consistently detected from the first observations following the July 21 outburst at 3.88 au, while OH was detected for the first time at 2.66 au, coinciding with the comet’s crossing of the water snow line. MISTRAL long-slit spectroscopy allowed detection of other species, notably NH2, and the H2O+ ion in the anti-sunward direction, illustrating the usefulness of long-slit spectroscopy to characterize the ion tail composition. The comet was found to be typical according to the A’Hearn et al. (1995) classification, consistent with the findigs by Ferellec et al. (2024). In contrast, Zhao et al. (2025), found 12P to be depleted in their measurements following the November 1 outburst. However, the use of different Haser model parameters and classification system (Cochran et al. 2012) complicates the direct comparison between the two studies.
No change in the coma colour indices was observed during the outbursts, indicating identical dust properties for quiescent and outbursting activity. Likewise, no change in the different gas production rate ratios was observed, pointing to a similar composition of the ices responsible for the outbursting and the quiescent activity. This points to the release in the coma of a large amount of the surface material with homogeneous composition. On the other hand, the A(0)fρ/CN ratio is increasing up to one order of magnitude more than the gas during the outbursts, indicating massive amounts of dust released during the outbursts. We reject the possibility that these observations result from an observational bias, such as the gas leaving the aperture faster than the dust, as the post-outburst activity decrease rate is comparable for both gas and dust (see Figure 3). This is contrasting with other active comets in the TRAPPIST survey that experienced outbursts, albeit within 1.5 au of the Sun, which did not show visible variation in the A(0)fρ/CN ratio (e.g. C/2021 A1 (Leonard) close to disintegration (Lippi et al. 2023), 73P/Schwassmann–Wachmann while splitting (Vander Donckt et al. 2023), and C/2013 A1 (Siding Spring) (Opitom et al. 2016)). This could give important constraints on outbursting models, since different mechanisms could be traced by different gas and dust ratios (Müller et al. 2024; Wierzchos & Womack 2020). Unfortunately, key coma tracers of previously mentioned outbursting mechanisms, such as CO and CO2, could not be detected from our facilities.
The velocity of the ejected dust shell during outbursts is consistent with the average dust speed found in cometary comas (in the order of 100–200 m/s) and shell expansion velocities measured in 29P outbursts (Miles et al. 2016; Schambeau et al. 2019). vshell for the July 21 outburst, 128 ± 64 m/s, was measured as 220 ± 38 m/s by Manzini et al. (2023) and 97 ± 10 m/s by Jewitt & Luu (2025). Differences in measurements could result from the coma expansion being measured in different directions, but are most probably due to different S/N thresholds to measure the shell boundary. From our internally consistent measurements, we find that vshell increases linearly with decreasing heliocentric distances scaling with ![Mathematical equation: $\[r_{h}^{-1.2 \pm 0.2}\]$](/articles/aa/full_html/2026/01/aa56202-25/aa56202-25-eq4.png) , in agreement with the
, in agreement with the ![Mathematical equation: $\[r_h^{-1.14}\]$](/articles/aa/full_html/2026/01/aa56202-25/aa56202-25-eq5.png) dependency measured by Biver et al. (2024). The second coma outburst feature observed, the double horn-shaped structure, is consistent with being shaped by the solar radiation pressure, given its orientation towards the projected Sun direction vector. An exception is the July 21 outburst, which shows no preferential orientation and calls for further dust modelling. Similar morphologies were observed in the coma of 29P.
dependency measured by Biver et al. (2024). The second coma outburst feature observed, the double horn-shaped structure, is consistent with being shaped by the solar radiation pressure, given its orientation towards the projected Sun direction vector. An exception is the July 21 outburst, which shows no preferential orientation and calls for further dust modelling. Similar morphologies were observed in the coma of 29P.
CN jets were not found to be correlated with ourbursts in either emergence or strength, but appeared regularly in images taken from rh ≈ 2 au onwards, indicating that the outbursting region(s) may not be linked to the active areas of the comet that produce the regular CN jets. The derived nucleus rotation period is to be 29.45 h, or its alias 58.90 h, the latter being in close agreement with the 57 ± 1 h found by Knight et al. (2024). The associated CN outflow velocity for the 58.90 h period of 1.03 ± 0.09 km/s is of the same order of magnitude as the 1.0 km/s found by Biver et al. (2024) for CH3OH at rh = 1.0 au, based on line shapes observed with the IRAM radio telescopes. However, both species are not necessarily linked in their formation processes and thus do not necessarily share the same velocity. Biver et al. (2024) also measured a ![Mathematical equation: $\[r_h^{-0.66}\]$](/articles/aa/full_html/2026/01/aa56202-25/aa56202-25-eq6.png) dependency on the velocity for CH3OH between January 20 and April 28, 2024, while we find no trend with the heliocentric distance between mid-December 2023 and mid-March 2024, within the uncertainties of our measurements.
dependency on the velocity for CH3OH between January 20 and April 28, 2024, while we find no trend with the heliocentric distance between mid-December 2023 and mid-March 2024, within the uncertainties of our measurements.
5 Summary and conclusion
In this study, we present a photometric and spectroscopic survey of the Halley-type comet 12P/Pons-Brook during its 2024 return to perihelion after 71 years, focusing on the evolution of its activity and composition. We followed the production rates of the dust, OH, CN, C2, C3, and NH through photometry, and also detected CN, C2, NH2, and H2O+ via spectroscopy.
Nine outbursts were identified in our dataset during the inbound leg of the orbit, each marked by a brightness increase in both gas and dust filters. The outbursts occurred at rh up to 3.88 au, beyond the water-dominated activity regime, and showed an approximate periodicity of two weeks. The other notable comet known to have periodic outbursts is the centaur 29P/Schwassmann–Wachmann, active at rh near ~6 au. The strongest 12P outbursts were followed by significant changes in the coma morphology, including the appearance of a double horn-shaped structure and the ejection of a dust shell. Expansion velocities of those shells were found to be consistent with typical dust ejection velocity in comas, ranging between 100 and 250 m/s, and dependent on rh as ![Mathematical equation: $\[r_{h}^{-1.2 \pm 0.2}\]$](/articles/aa/full_html/2026/01/aa56202-25/aa56202-25-eq7.png) . Outbursts were detected exclusively during the inbound leg of the orbit, during this apparition, as well as in the historical reports. This apparent seasonal effect suggests a non-uniform distribution of the active region on the nucleus, regardless of the outbursting mechanism. However, limited coverage during the outbound leg of the orbit in this study and historical reports limits our ability to conclude whether the activity is truly seasonal.
. Outbursts were detected exclusively during the inbound leg of the orbit, during this apparition, as well as in the historical reports. This apparent seasonal effect suggests a non-uniform distribution of the active region on the nucleus, regardless of the outbursting mechanism. However, limited coverage during the outbound leg of the orbit in this study and historical reports limits our ability to conclude whether the activity is truly seasonal.
No significant change in the gas production rate ratios was observed during outbursts, suggesting a common composition between the surface material responsible for the quiescent activity and the material released during the outbursts. Likewise, no variation in the dust colour was detected, indicating homogeneous dust properties during quiescent and outbursting activity. However, the A(0)fρ/CN ratio in the coma changed dramatically during outbursts, contrasting with outbursts observed in other comets, within the water-dominated activity regime. These findings suggest different drivers or mechanisms at play for periodic outbursts. Unfortunately, the lack of CO and CO2 measurement during 12P outbursts prevents us from determining whether the outbursts in 12P are intrinsically more dust-rich or if the gas component is dominated by undetected species.
Two 180°-apart CN jets were observed in images between rh = 2.13 to 1.02 au. These jets appeared uncorrelated with the outbursting activity, pointing to different regions driving the outburst and quiescent activity. Analysis of the jets allowed us to constrain the nucleus rotation period to either 29.45 h or its alias 58.90 h. Assuming the period of 58.90 h, a gas outflow velocity of 1.03 ± 0.09 km/s could be measured, which is a typical gas coma expansion velocity at 1 au (Cochran & Schleicher 1993).
Comet 12P was found to have a typical composition, with a log(C2/CN) of 0.10 ± 0.16. Spectra obtained at rh = 0.93 au revealed emission bands of C2, NH2, and CN and allowed us to calculate the C2 production rate, that was found to be consistent with the narrow-band photometry. Furthermore, H2O+ bands were detected in the tailward direction and confirmed to be of cometary origin by comparing spectra extracted in the tailward and anti-tailward directions.
Data availability
Tables A.1 and A.2 are available at the CDS via https://cdsarc.cds.unistra.fr/viz-bin/cat/J/A+A/705/A89.
Acknowledgements
We thank the anonymous referee for their valuable comments and suggestions, which improved the quality and presentation of this work. TRAPPIST is funded by the Belgian Fund for Scientific Research (Fond National de la Recherche Scientifique, FNRS) under the grant PDR T.0120.21. TRAPPIST-North is a project funded by the University of Liege (Belgium), in collaboration with the Cadi Ayyad University of Marrakech (Morocco). Based in part on observations made at the Observatoire de Haute Provence (CNRS), France, with MISTRAL. This research has made use of the MISTRAL database, operated at CeSAM (LAM), Marseille, France This work was facilited by the bilateral Belgo-Indian projects on Precision Astronomical Spectroscopy for Stellar and Solar system bodies, BIPASS, funded by the Belgian Federal Science Policy Office (BELSPO, Government of Belgium; BL/33/IN22_BIPASS) and the International Division, Department of Science and Technology, (DST, Government of India; DST/INT/BELG/P-01/2021(G)). M.V.D. acknowledges support from the French-speaking Community of Belgium through its FRIA grant. He thanks Sandrine Sohy for continuous technical support. E.J. is Director of Research at FNRS. C.A. thanks the OHP night operators: Jean Balcaen, Yoann Degot-Longui, Stephane Favard, and Jean Pierre Troncin.
References
- A’Hearn, M. F., Schleicher, D. G., Millis, R. L., Feldman, P. D., & Thompson, D. T. 1984, AJ, 89, 579 [Google Scholar]
- A’Hearn, M. F., Millis, R. C., Schleicher, D. G., Osip, D. J., & Birch, P. V. 1995, Icarus, 118, 223 [CrossRef] [Google Scholar]
- Aravind, K., Halder, P., Ganesh, S., et al. 2022, Icarus, 383, 115042 [NASA ADS] [CrossRef] [Google Scholar]
- Astropy Collaboration (Price-Whelan, A. M., et al.) 2022, ApJ, 935, 167 [NASA ADS] [CrossRef] [Google Scholar]
- Betzler, A., Almeida, R., Cerqueira, W., et al. 2017, ASR, 60, 612 [Google Scholar]
- Biver, N., Boissier, J., Bockelée-Morvan, D., et al. 2024, European Planetary Science Congress, EPSC2024, 371 [Google Scholar]
- Bockelée-Morvan, D., Biver, N., Schambeau, C. A., et al. 2022, A&A, 664, A95 [NASA ADS] [CrossRef] [EDP Sciences] [Google Scholar]
- Bradley, L., Sipocz, B., Robitaille, T., et al. 2024, astropy/photutils: 2.0.2, Zenodo, https://doi.org/10.5281/zenodo.13989456 [Google Scholar]
- Cochran, A. L., & Schleicher, D. G. 1993, Icarus, 105, 235 [Google Scholar]
- Cochran, A. L., Barker, E. S., & Gray, C. L. 2012, Icarus, 218, 144 [Google Scholar]
- Crovisier, J., & Encrenaz, T. 2000, Comet Science: the Study of Remnants from the Birth of the Solar System (Cambridge: Cambridge University Press) [Google Scholar]
- Dokkum, P. G. v. 2001, PASP, 113, 1420 [CrossRef] [Google Scholar]
- Farnham, T., Schleicher, D., & A’Hearn, M. 2000, Icarus, 147, 180 [NASA ADS] [CrossRef] [Google Scholar]
- Ferellec, L., Opitom, C., Donaldson, A., et al. 2024, MNRAS, 534, 1816 [Google Scholar]
- Fink, U. 2009, Icarus, 201, 311 [Google Scholar]
- Haser, L. 1957, Bull. Acad. Belg, 43, 740 [Google Scholar]
- Hsieh, H. H., Fitzsimmons, A., Joshi, Y., Christian, D., & Pollacco, D. L. 2010, MNRAS, 407, 1784 [Google Scholar]
- Hughes, D. W. 1975, QJRAS, 16, 410 [Google Scholar]
- Hui, M.-T., Farnocchia, D., & Micheli, M. 2019, AJ, 157, 162 [NASA ADS] [CrossRef] [Google Scholar]
- Jehin, E., Donckt, M. V., Manfroid, J., & Moulane, Y. 2022, ATel, 15673, 1 [Google Scholar]
- Jehin, E., Gillon, M., Queloz, D., et al. 2011, The Messenger, 145, 2 [NASA ADS] [Google Scholar]
- Jewitt, D. 2015, AJ, 150, 201 [NASA ADS] [CrossRef] [Google Scholar]
- Jewitt, D., & Luu, J. 2025, AJ, 169, 338 [Google Scholar]
- Jewitt, D., Kim, Y., Mutchler, M., et al. 2020, ApJ, 896, L39 [NASA ADS] [CrossRef] [Google Scholar]
- Kelley, M. S. P., Kokotanekova, R., Holt, C. E., et al. 2022a, ApJ, 933, L44 [NASA ADS] [CrossRef] [Google Scholar]
- Kelley, M. S. P., Lister, T., & Hol, C. E. 2022b, ATel, 15560, 1 [Google Scholar]
- Kim, S. J., A’hearn, M. F., & Cochran, W. D. 1989, Icarus, 77, 98 [Google Scholar]
- Knight, M. M., Skiff, B. A., Schleicher, D. G., et al. 2024, ATel, 16508, 1 [Google Scholar]
- Kronk, G. W. 1999, Cometography: Volume 2, 1800-1899: A Catalog of Comets (Cambridge: Cambridge University Press) [Google Scholar]
- Kronk, G. W. 2009, Cometography: Volume 4, 1933-1959: A Catalog of Comets (Cambridge: Cambridge University Press) [Google Scholar]
- Larson, S. M., & Sekanina, Z. 1984, AJ, 89, 571 [NASA ADS] [CrossRef] [Google Scholar]
- Lee, S.-H., & Park, S.-J. 2006, JKAS, 39, 151 [Google Scholar]
- Lew, H. 1976, Can. J. Phys., 54, 2028 [Google Scholar]
- Li, J., Jewitt, D., Clover, J. M., & Jackson, B. V. 2011, ApJ, 728, 31 [Google Scholar]
- Li, J., Shi, X., Shi, J., et al. 2025, A&A, 701, A204 [NASA ADS] [CrossRef] [EDP Sciences] [Google Scholar]
- Lin, Z.-Y., Lin, C.-S., Ip, W.-H., & Lara, L. M. 2009, AJ, 138, 625 [Google Scholar]
- Lippi, M., Vander Donckt, M., Faggi, S., et al. 2023, A&A, 676, A105 [NASA ADS] [CrossRef] [EDP Sciences] [Google Scholar]
- Manzini, F., Oldani, V., Ochner, P., Bedin, L. R., & Reguitti, A. 2023, ATel, 16194, 1 [Google Scholar]
- Marcus, J. N. 2007, ICQ, 29, 39 [Google Scholar]
- Meyer, M., Kobayashi, T., Nakano, S., & Green, D. W. E. 2020, Comet 12P/Pons-Brooks: Identification with Comets C/1385 U1 and C/1457 A1, [arXiv:2012.15583] [astro-ph] [Google Scholar]
- Miles, R. 2016, Icarus, 272, 387 [NASA ADS] [CrossRef] [Google Scholar]
- Miles, R., Faillace, G. A., Mottola, S., et al. 2016, Icarus, 272, 327 [Google Scholar]
- Mommert, M., Kelley, M. S. p., Val-Borro, M. d., et al. 2019, JOSS, 4, 1426 [Google Scholar]
- Moulane, Y., Jehin, E., Opitom, C., et al. 2018, A&A, 619, A156 [NASA ADS] [CrossRef] [EDP Sciences] [Google Scholar]
- Müller, D. R., Altwegg, K., Berthelier, J.-J., et al. 2024, MNRAS, 529, 2763 [Google Scholar]
- Müller, D. R., Altwegg, K., Berthelier, J.-J., et al. 2025, MNRAS, 537, 2997 [Google Scholar]
- Noonan, J. W., Rinaldi, G., Feldman, P. D., et al. 2021, AJ, 162, 4 [NASA ADS] [CrossRef] [Google Scholar]
- Ootsubo, T., Kawakita, H., Hamada, S., et al. 2012, ApJ, 752, 15 [Google Scholar]
- Opitom, C., Jehin, E., Manfroid, J., et al. 2015, A&A, 574, A38 [NASA ADS] [CrossRef] [EDP Sciences] [Google Scholar]
- Opitom, C., Guilbert-Lepoutre, A., Jehin, E., et al. 2016, A&A, 589, A8 [NASA ADS] [CrossRef] [EDP Sciences] [Google Scholar]
- Pajola, M., Höfner, S., Vincent, J. B., et al. 2017, Nat. Astron., 1, 0092 [NASA ADS] [CrossRef] [Google Scholar]
- Schambeau, C. A., Fernández, Y. R., Samarasinha, N. H., Woodney, L. M., & Kundu, A. 2019, AJ, 158, 259 [Google Scholar]
- Schleicher, D. G. 2010, AJ, 140, 973 [Google Scholar]
- Schleicher, D. G., & A’Hearn, M. F. 1988, ApJ, 331, 1058 [Google Scholar]
- Schleicher, D. G., & Osip, D. J. 2002, Icarus, 159, 210 [Google Scholar]
- Schleicher, D. G., Millis, R. L., & Birch, P. V. 1998, Icarus, 132, 397 [NASA ADS] [CrossRef] [Google Scholar]
- Schmitt, J., Adami, C., Dennefeld, M., et al. 2024, A&A, 687, A198 [NASA ADS] [CrossRef] [EDP Sciences] [Google Scholar]
- Tao, J., Qian, B.-c., Gu, M.-f., Tang, Y., & Song, B.-j. 2000, P&SS, 48, 153 [Google Scholar]
- Tomko, D., & Neslušan, L. 2016, A&A, 592, A107 [NASA ADS] [CrossRef] [EDP Sciences] [Google Scholar]
- Vander Donckt, M., Aravind, K., Jehin, E., et al. 2023, Asteroids Comets Meteors Conf., 2851, 2461 [Google Scholar]
- Wang, J.-H., & Brasser, R. 2014, A&A, 563, A122 [NASA ADS] [CrossRef] [EDP Sciences] [Google Scholar]
- Whitney, C. 1955, ApJ, 122, 190 [Google Scholar]
- Wierzchos, K., & Womack, M. 2020, AJ, 159, 136 [NASA ADS] [CrossRef] [Google Scholar]
- Ye, Q., Farnham, T. L., Knight, M. M., Holt, C. E., & Feaga, L. M. 2020, RNAAS, 4, 101 [Google Scholar]
- Zhao, R., Yang, B., Kelley, M. S. P., et al. 2025, ApJ, 989, 146 [Google Scholar]
Orbital solution JPL#K213/6 (https://ssd.jpl.nasa.gov/horizons).
All Tables
Medians of the logarithms of the 12P abundance ratios compared to the taxonomic groups found by A’Hearn et al. (1995).
All Figures
|
Fig. 1 Magnitude and colour evolution of 12P. Top: light curve of comet 12P with TRAPPIST in the Rc band with an aperture radius of 5″. Upper arrows indicate saturated images that could only yield an upper limit on the magnitude. The detected outbursts are indicated with red tick marks. The vertical dashed line indicates perihelion. Bottom: colour indices from the BVRcIc filters. Reference colour indices for long-period comets (LPC) from Jewitt (2015) are indicated as horizontal dashed lines. No colour indices are available for the post-perihelion survey. The vertical dashed line indicates perihelion. |
| In the text | |
|
Fig. 2 Comet 12P images in the Rc filter during different outbursts. Each row shows a different outburst. Columns, from left to right, correspond to pre-outburst image, coma around 4 days after outburst, same image after subtraction by an azimuthal median profile, coma around 7 days after outburst, and same image after subtraction by an azimuthal median profile. The yellow and the white arrows are the anti-sunward and the negative of the target heliocentric velocity vector directions, respectively. The red cross indicates the photocentre. Images are oriented with north being up and east to the left. |
| In the text | |
|
Fig. 3 Gas and dust activity evolution of 12P. Top: production rates obtained from TRAPPIST and MISTRAL, and by Ferellec et al. (2024) and Li et al. (2025). Downward arrows represent upper limits, where the threshold is determined by the measurement uncertainty (see Section 2). Bottom: A(θ)fρ with the Rc filter measured in a 10000 km aperture. Upward arrows indicate a lower limit due to saturated images. Both are logarithmic scales to better show the outbursts. |
| In the text | |
|
Fig. 4 Gas and dust abundance ratios. The outbursts are indicated with red tick marks. The ranges for typical and depleted comets as defined by A’Hearn et al. (1995) are indicated in blue and orange, respectively. C3/CN reference from A’Hearn et al. (1995) has been shifted by 0.32 to compensate for different continuum removal factors between the studies (see Notes Table 3). Afρ/CN references from A’Hearn et al. (1995) are not corrected for the phase angle, while the Afρ phase correction factor applied to 12P in this study ranges between 0.64 and 0.38. |
| In the text | |
|
Fig. 5 Comet 12P MISTRAL spectra. Top: main emission bands visible in the spectrum extracted at the photocentre. Middle: comparison between tailward and anti-tailward spectra, highlighting the H2O+ detection. Bottom: zoom on H2O+ features. |
| In the text | |
|
Fig. 6 Comet 12P in the CN filter (300s exposure time) after subtraction of an azimuthal median profile on selected dates. The yellow and white arrows are the anti-sunward and the negative of the target heliocentric velocity vector directions, respectively. The red cross indicates the photocentre. Images are oriented with north being up and east to the left. |
| In the text | |
Current usage metrics show cumulative count of Article Views (full-text article views including HTML views, PDF and ePub downloads, according to the available data) and Abstracts Views on Vision4Press platform.
Data correspond to usage on the plateform after 2015. The current usage metrics is available 48-96 hours after online publication and is updated daily on week days.
Initial download of the metrics may take a while.