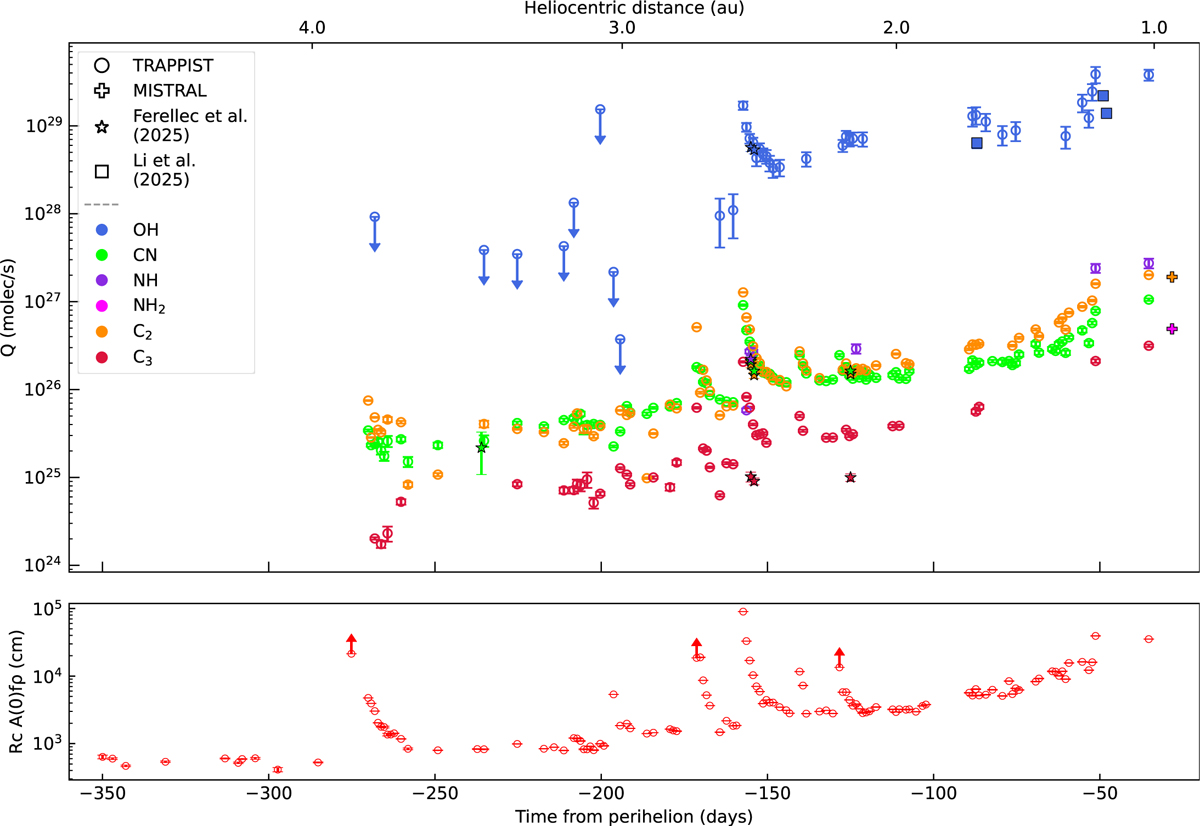
Fig. 3
Download original image
Gas and dust activity evolution of 12P. Top: production rates obtained from TRAPPIST and MISTRAL, and by Ferellec et al. (2024) and Li et al. (2025). Downward arrows represent upper limits, where the threshold is determined by the measurement uncertainty (see Section 2). Bottom: A(θ)fρ with the Rc filter measured in a 10000 km aperture. Upward arrows indicate a lower limit due to saturated images. Both are logarithmic scales to better show the outbursts.
Current usage metrics show cumulative count of Article Views (full-text article views including HTML views, PDF and ePub downloads, according to the available data) and Abstracts Views on Vision4Press platform.
Data correspond to usage on the plateform after 2015. The current usage metrics is available 48-96 hours after online publication and is updated daily on week days.
Initial download of the metrics may take a while.